Fig. 9.
Download original image
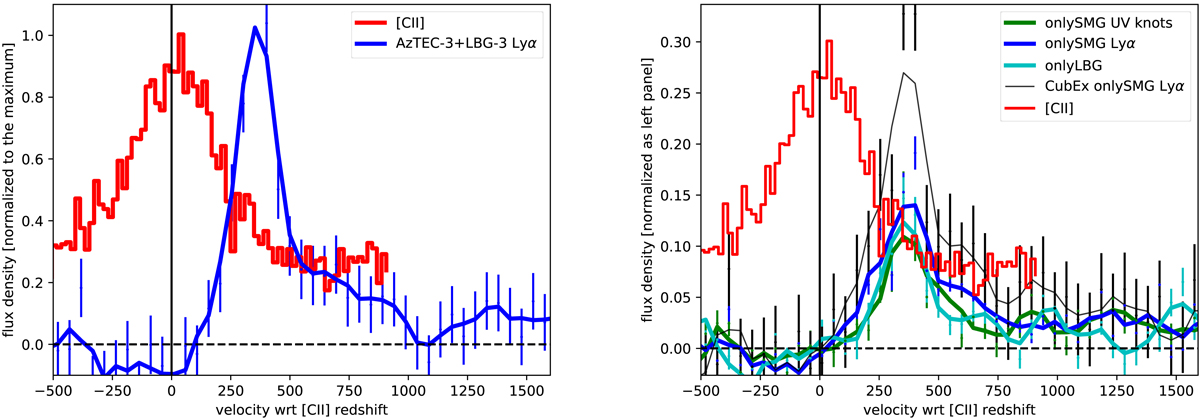
Left panel: Lyα (blue) and [C II] (red) profiles of the AzTEC-3+LBG-3 system in velocity space and normalized to the maximum. The [C II] spectrum is taken from Riechers et al. (2014) and it is associated to AzTEC-3 (see Fig. 7). Right panel: normalized [C II] profile (red), Lyα profile of the emission extracted at the position of the main Lyα peak associated to the SMG (blue and black curves), extracted from the position of the rest-frame UV knots of AzTEC-3 as seen in the F160W image (green), and extracted at the position of the main Lyα peak associated to LBG-3 (cyan). The extraction is done in an aperture of 0.7″ radius for the blue, green, and cyan profiles and increasing the S/N of the connected pixels in CubEx for the black profile. For simplicity, we call the spectra as onlySMG Lyα, onlySMG UV knots, and onlyLBG. The normalization of these spectra is performed with the same factor used to normalize the spectrum of the AzTEC-3+LBG-3 system in the left panel to show the different intensities. The normalization of the [C II] profile is also performed accordingly.
Current usage metrics show cumulative count of Article Views (full-text article views including HTML views, PDF and ePub downloads, according to the available data) and Abstracts Views on Vision4Press platform.
Data correspond to usage on the plateform after 2015. The current usage metrics is available 48-96 hours after online publication and is updated daily on week days.
Initial download of the metrics may take a while.