Fig. 8.
Download original image
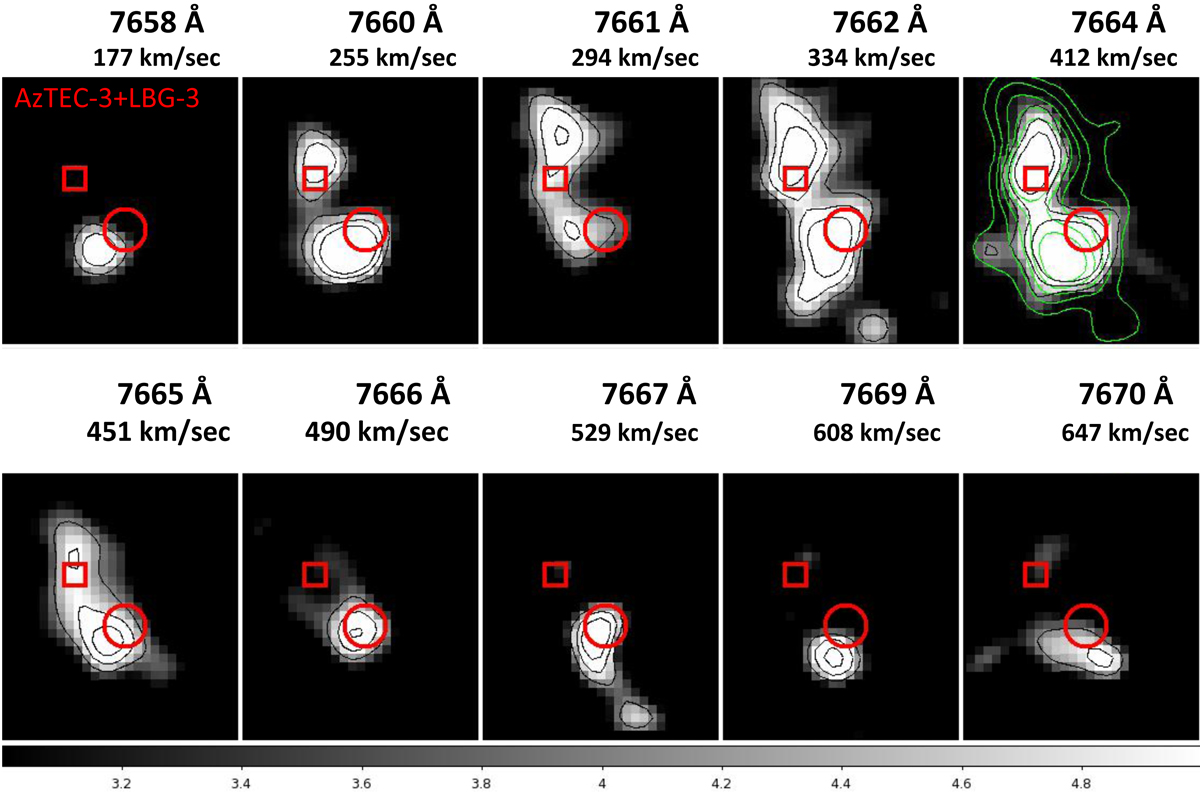
Lyα channel maps toward the AzTEC-3+LBG-3 system. Each panel corresponds to the indicated wavelength and velocities with respect to the systemic redshift inferred from the [C II] emission line. The white contours represent the isophotes at S/N = 4, 5, and 6. The red square corresponds to the F160W position of LBG-3 and the red circle to the location of the peak of the [C II] emission of AzTEC-3. The green contours in the fifth panel represent the contours of the continuum-subtracted Lyα surface brightness. The horizontal gray-color bar shows a signal-to-noise ratio from 3 to 5. We refer to Fig. 7 for the 1″ scale.
Current usage metrics show cumulative count of Article Views (full-text article views including HTML views, PDF and ePub downloads, according to the available data) and Abstracts Views on Vision4Press platform.
Data correspond to usage on the plateform after 2015. The current usage metrics is available 48-96 hours after online publication and is updated daily on week days.
Initial download of the metrics may take a while.