Fig. 7.
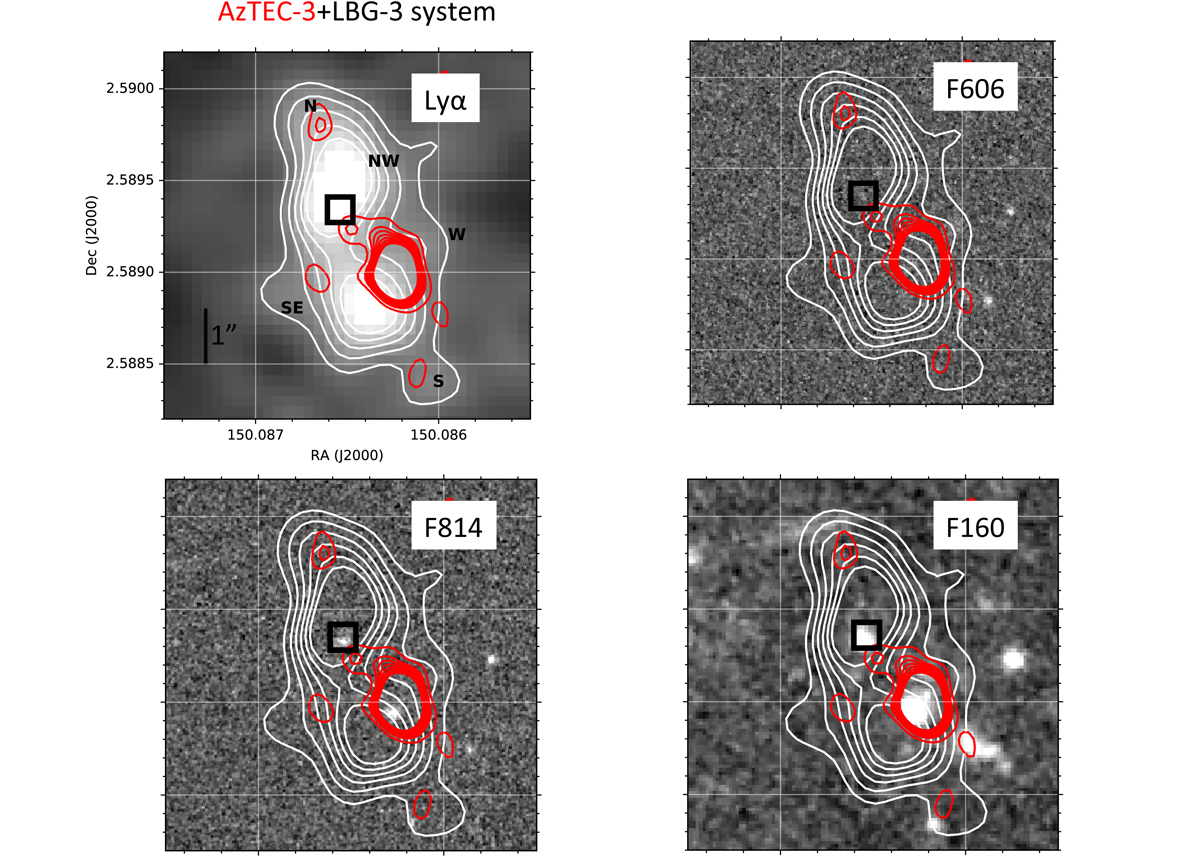
Download original image
Upper left: signal-to-noise optimally extracted narrow-band image (Borisova et al. 2016) of the continuum-subtracted Lyα emission toward the AzTEC-3+LBG-3 system, rescaled to surface brightness units, and smoothed using a 2-pixel Gaussian kernel. The narrow band is built considering the 13 wavelength channels of the detection. The 5 white contours reveal the 1.3 to 3.8 erg s−1 cm−2 arcsec−2 levels, which correspond to 3−10σ in this image. The black letters indicate the directions we refer to in the text (N = north, NW = northwest, S = south, SE = southeast, W = west of the SMG). The small black segment indicates the 1″ scale. We also show the continuum-subtracted Lyα surface brightness contours overplotted to the HST ACS F606W (upper right), F814W (lower left), and F160W (bottom right) images. The 0.5″-side square indicates the center of the F160W position of LBG-3. The PSF of our MUSE data is 0.7″, corresponding to about 4 kpc or 27 ckpc at z = 5.3. The eight red contours correspond to the [C II] emission (from 3σ to 10σ where 1σ = 2.38 × 10⁻⁴ Jy beam−1) at 301.671−302.142 GHz, corresponding to −230 to 230 km s−1 from the peak emission. The synthesized beam of the [C II] ALMA observations is 0.63″ × 0.56″ as reported in Riechers et al. (2014). The 3σ contour extends toward LBG-3.
Current usage metrics show cumulative count of Article Views (full-text article views including HTML views, PDF and ePub downloads, according to the available data) and Abstracts Views on Vision4Press platform.
Data correspond to usage on the plateform after 2015. The current usage metrics is available 48-96 hours after online publication and is updated daily on week days.
Initial download of the metrics may take a while.