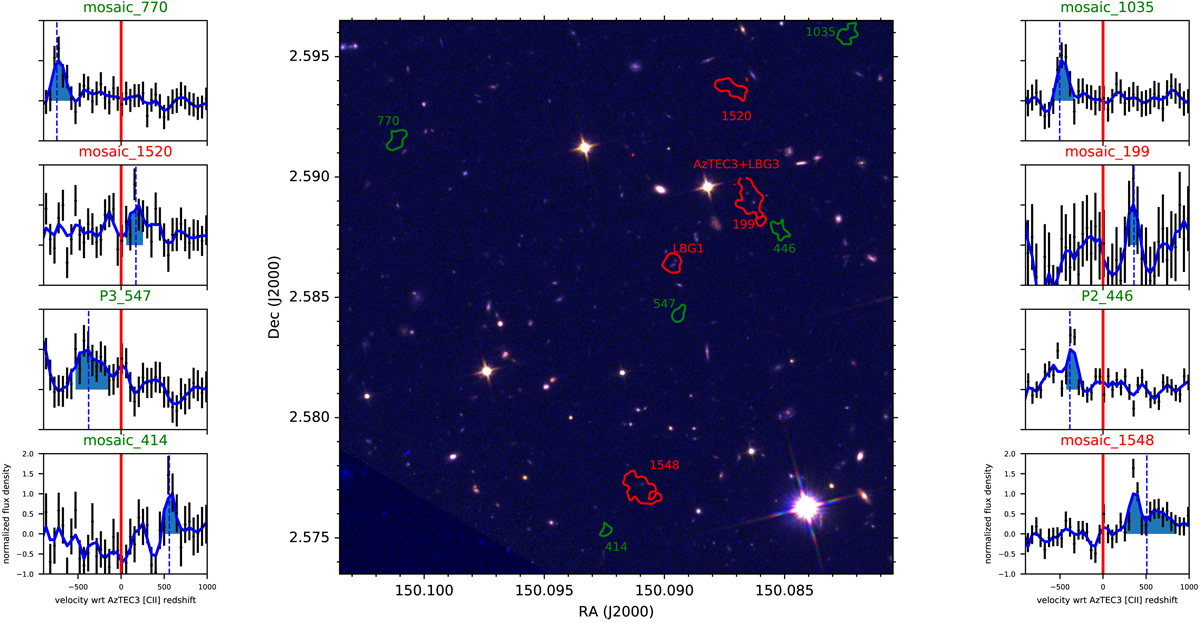
Fig. 3.

Download original image
RGB image composed of the HST images in F814W, F125W, and F160W filters covering the area of our MUSE observations. The overlaid contours represent the 3σ levels of the Lyα emission. Red contours correspond to the sources with counterparts in the COSMOS2015 catalog. Green contours correspond to the Lyα detections without counterparts. The inserts contain the normalized Lyα profiles (normalized flux density versus velocity) of the Lyα detections indicated in the title of the inserts. The wavelengths of the maximum of the line detected by CubEx is indicated with a vertical dashed blue line. The blue shaded areas correspond to the spectral pixel ranges of the lines detected by CubEx. The zero velocity corresponds to the systemic redshift of the [C II] detection of AzTEC-3 and it is indicated as a vertical red line in each insert.
Current usage metrics show cumulative count of Article Views (full-text article views including HTML views, PDF and ePub downloads, according to the available data) and Abstracts Views on Vision4Press platform.
Data correspond to usage on the plateform after 2015. The current usage metrics is available 48-96 hours after online publication and is updated daily on week days.
Initial download of the metrics may take a while.


