Free Access
Fig. A.8.
Download original image
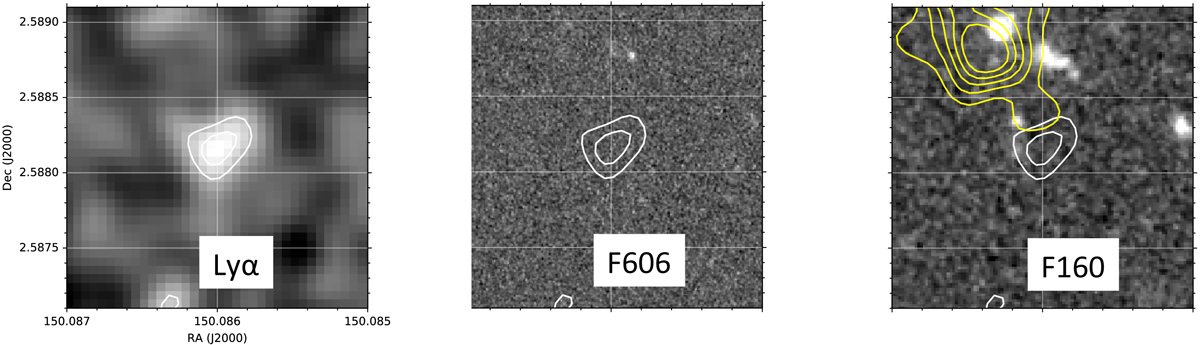
Same as Fig. A.1, but for the mosaic_199 source. The two white contours correspond to 0.5 × 10⁻¹⁸ and 0.7 × 10⁻¹⁸ erg sec−1 cm−2 arcsec−2. A source is visible in the F160W image which is COSMOS2015_848724. Some low SN emission could be blended with the AzTEC-3+LBG-3 system (yellow contours).
Current usage metrics show cumulative count of Article Views (full-text article views including HTML views, PDF and ePub downloads, according to the available data) and Abstracts Views on Vision4Press platform.
Data correspond to usage on the plateform after 2015. The current usage metrics is available 48-96 hours after online publication and is updated daily on week days.
Initial download of the metrics may take a while.