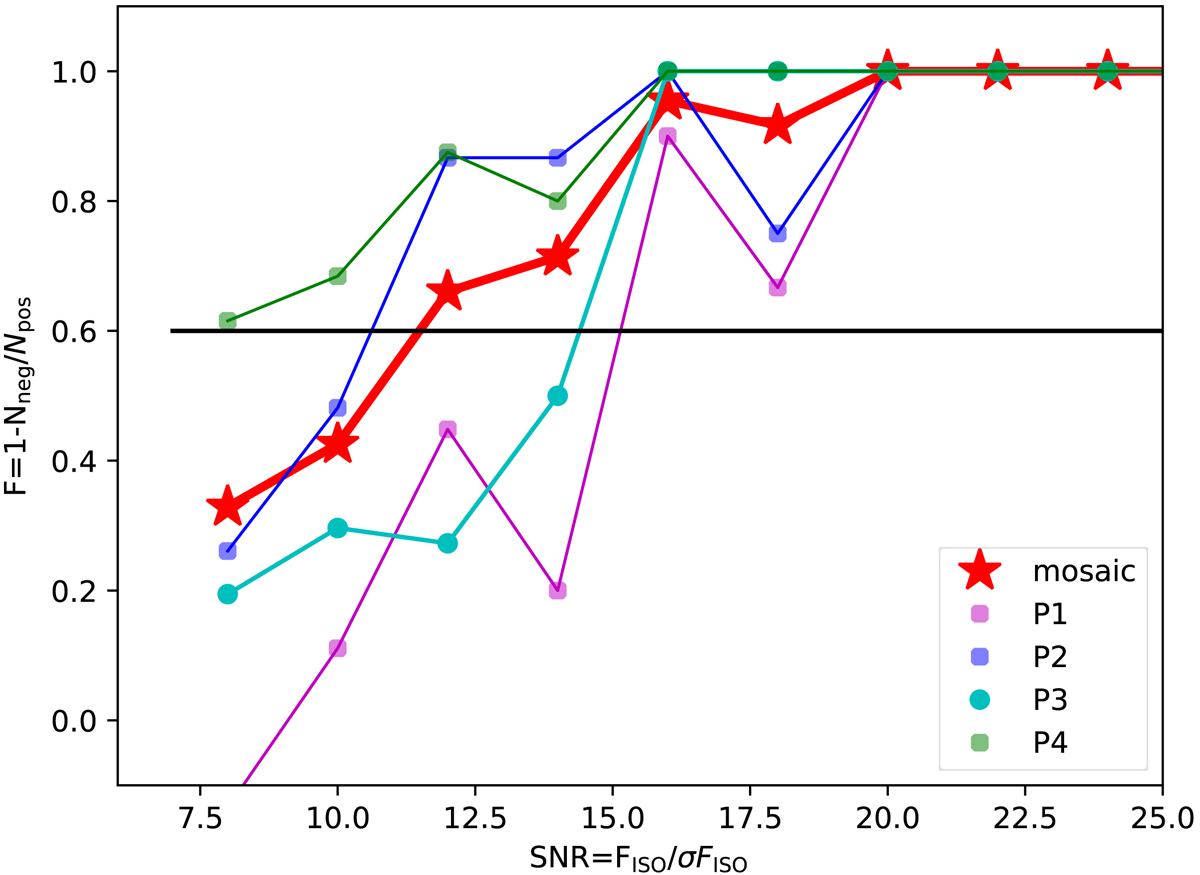
Fig. 2.
Download original image
Detection fidelity as a function of signal-to-noise ratio. The fidelity is expressed as 1 − Nneg/Npos, where Nnegis the numbers of the sources detected in the datacubes multiplied by −1 and Npos in the number of the detections in the original datacubes, when we apply the list of detection criteria described in the text. The red stars and line correspond to the detections in the “mosaic”, while the other lines correspond to the individual pointings, magenta for P1, blue for P2, cyan for P3, and green for P4. The signal-to-noise ratio in the x-axis correspond to the ratio between the isophotal flux and its error as provided by CubEx. The shapes of the lines reflect the uncertainty in the fidelity measurement.
Current usage metrics show cumulative count of Article Views (full-text article views including HTML views, PDF and ePub downloads, according to the available data) and Abstracts Views on Vision4Press platform.
Data correspond to usage on the plateform after 2015. The current usage metrics is available 48-96 hours after online publication and is updated daily on week days.
Initial download of the metrics may take a while.