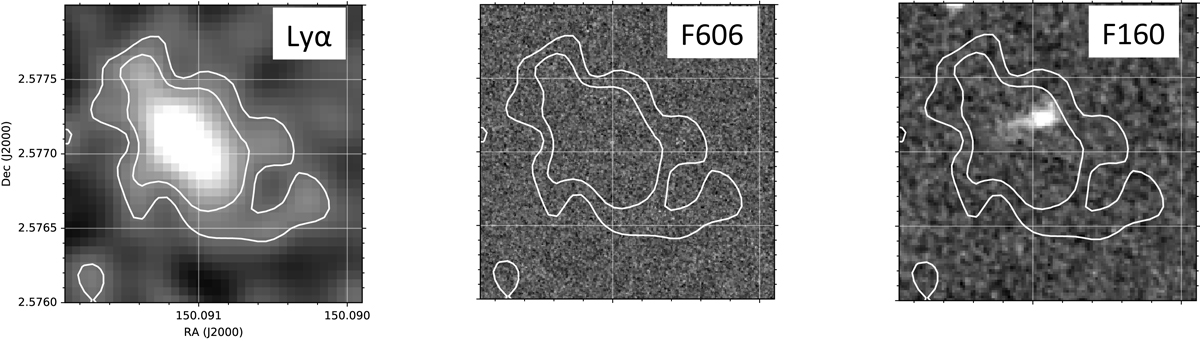
Fig. A.1.
Download original image
Optimally extracted narrow-band images of the Lyα emission mosaic_1548 (left panel) and contours in surface brightness units. The two white contours correspond to 3 and 4σ above the background, based on the S/N map provided by CubEx. In this case they correspond to 0.7 × 10⁻¹⁸ and 1.2 × 10⁻¹⁸ erg sec−1 cm−2 arcsec−2. Stamps of the source in the HST F606W and F160W images are shown in the middle and right panels, together with the narrow-band surface brightness contours. The source within the contours of the right panel is COSMOS2015_841844 and it has a 0.4″ and a 1″ axes in the F160W image. The size of the pictures are adapted to contain exactly the entire emission.
Current usage metrics show cumulative count of Article Views (full-text article views including HTML views, PDF and ePub downloads, according to the available data) and Abstracts Views on Vision4Press platform.
Data correspond to usage on the plateform after 2015. The current usage metrics is available 48-96 hours after online publication and is updated daily on week days.
Initial download of the metrics may take a while.