Fig. 18.
Download original image
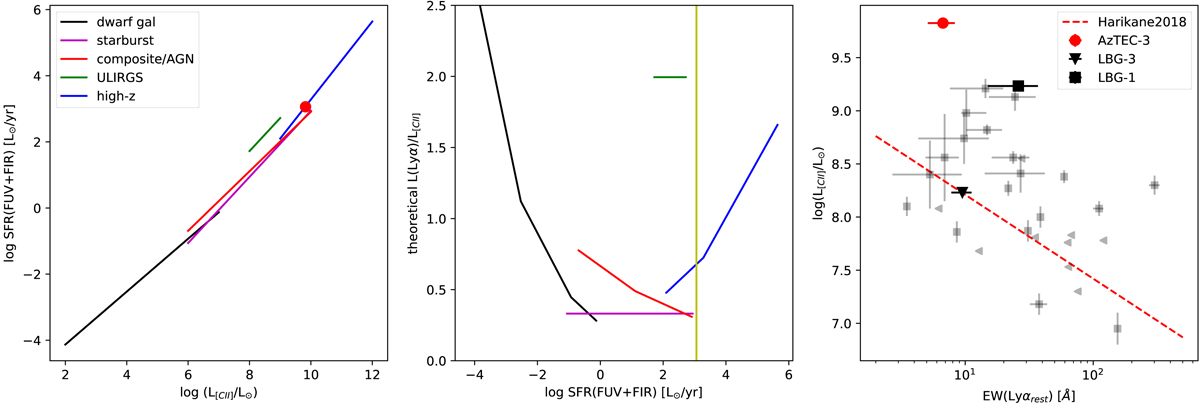
Left panel: total SFR vs [C II] luminosity from the empirical relations of De Looze et al. (2014). The red circle corresponds to the total SFR and L([C II]) of AzTEC-3. Middle panel: theoretical value of L(Lyα)/L([C II]) versus total SFR obtained assuming that SFR(Lyα) is equal to the total SFR and SFR(Lyα) is calculated with the calibration from Kennicutt (1998). This calculation is intended to give an idea of the theoretical value of L(Lyα)/L([C II]) at the location where the [C II] emission is concentrated. The vertical yellow line correspond to the total SFR of AzTEC-3 for all the possible values of L(Lyα)/L([C II]). Right panel: observed L(Lyα)/L([C II]) versus rest-frame Lyα equivalent width as shown in Harikane et al. (2018). The average relation for all the galaxies in that work is shown as a red dashed line. The gray symbols are their data points for the sources with a Lyα detection, excluding the upper limits. The red and black symbols correspond to AzTEC-3 (red circle), LBG-3 (black facedown triangle), and LBG-1 (black square).
Current usage metrics show cumulative count of Article Views (full-text article views including HTML views, PDF and ePub downloads, according to the available data) and Abstracts Views on Vision4Press platform.
Data correspond to usage on the plateform after 2015. The current usage metrics is available 48-96 hours after online publication and is updated daily on week days.
Initial download of the metrics may take a while.