Fig. 17.
Download original image
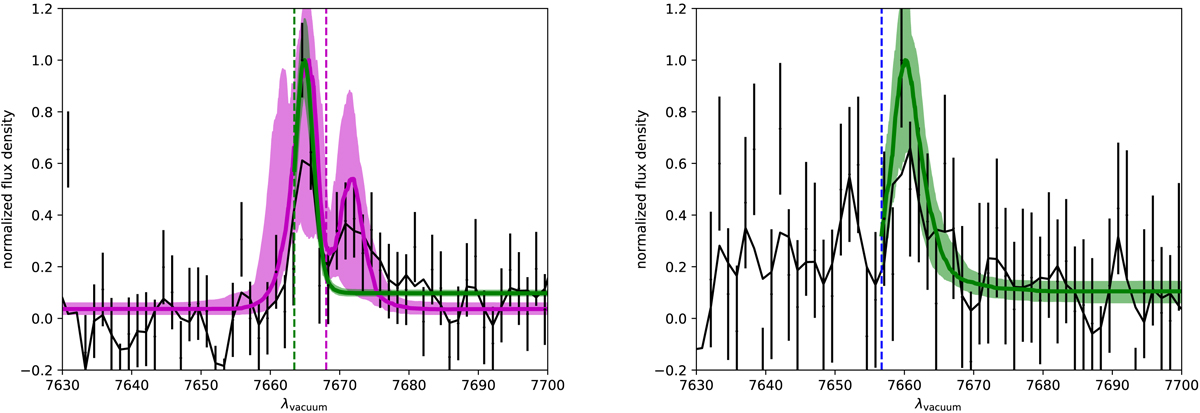
Observed-frame spectrum at the Lyα wavelength of mosaic_1548 (left), mosaic_1520 (right). The observed spectrum in vacuum wavelengths is shown as black data points with error bars, the black curve is the smoothed spectrum. The green curve is the best-fit zELDA model of a redshifted Lyα main peak that corresponds to percentile 50 and the green shaded area contains the models within percentiles 16 to 84. The vertical blue dashed lines indicate the Lyα redshift given by the 50th percentile model. For the left hand side spectrum, we also show in magenta a zELDA fit of the two visible peaks at 7665 and 7672 Å. The systemic wavelength corresponding to this fit is at 7668.1 Å and the model implies a blue peak higher than the red peak as in the case of an inflow (see Table 2 for the best fit parameters).
Current usage metrics show cumulative count of Article Views (full-text article views including HTML views, PDF and ePub downloads, according to the available data) and Abstracts Views on Vision4Press platform.
Data correspond to usage on the plateform after 2015. The current usage metrics is available 48-96 hours after online publication and is updated daily on week days.
Initial download of the metrics may take a while.