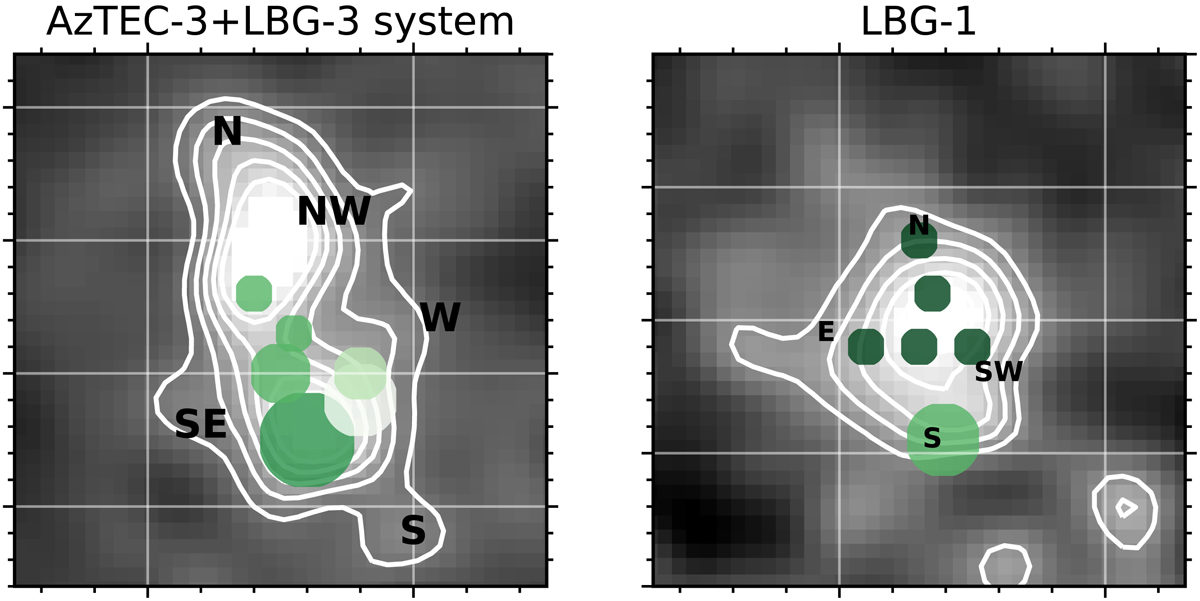
Fig. 16.
Download original image
Qualitative representation of the combination of the zELDA parameters that best fit the Lyα emission of the AzTEC-3+LBG-3 system (left panel) and of the LBG-1 region (right panel). The size of the dots in the cartoon is proportional to Vexp and the color scale corresponds to the N HI value in a way that fainter color indicates lower N HI. The smallest and darkest dots show Vexp < 30 km s−1 and N HI ∼ 1021 atoms cm−2. The largest dot corresponds to Vexp up to 800 km s−1, the faintest color to N HI ∼ 1019 atoms cm−2.
Current usage metrics show cumulative count of Article Views (full-text article views including HTML views, PDF and ePub downloads, according to the available data) and Abstracts Views on Vision4Press platform.
Data correspond to usage on the plateform after 2015. The current usage metrics is available 48-96 hours after online publication and is updated daily on week days.
Initial download of the metrics may take a while.