Fig. 15.
Download original image
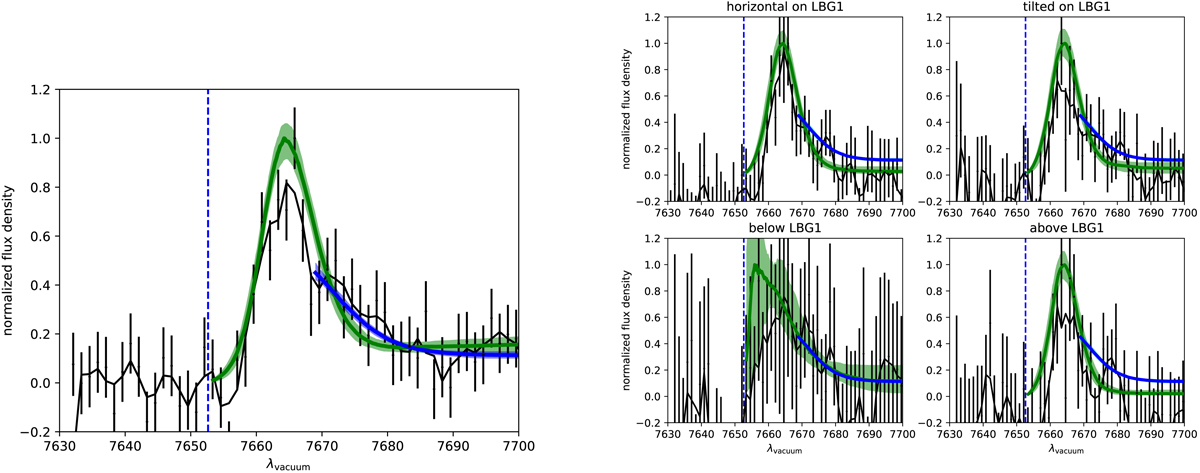
Left panel: observed-frame spectrum at the Lyα wavelength of LBG-1. The observed spectrum in vacuum wavelengths is shown as black datapoints with error bar, the black curve is the smoothed spectrum. The green curve is the best-fit zELDA model that corresponds to percentile 50 and the green shaded area contains the models within percentiles 16 to 84. The blue curve corresponds to a zELDA fit at wavelengths larger than 7669 Å, obtained with the scope of finding a zELDA model for the extended tail at wavelengths larger than the main red peak. Right panels: zELDA fits of the spectra obtained collapsing the LBG-1 spectrum as in Fig. 13. In green, we show the best fit and the models within the 16th and 84th percentile obtained for wavelengths larger than the systemic redshift. The blue curves correspond to the best fit of the extended tail for the spectrum in the left panel. Vertical blue dashed lines indicate the Lyα redshift given by the LBG-1 [C II] detection, we fixed while performing the fits.
Current usage metrics show cumulative count of Article Views (full-text article views including HTML views, PDF and ePub downloads, according to the available data) and Abstracts Views on Vision4Press platform.
Data correspond to usage on the plateform after 2015. The current usage metrics is available 48-96 hours after online publication and is updated daily on week days.
Initial download of the metrics may take a while.