Fig. 13.
Download original image
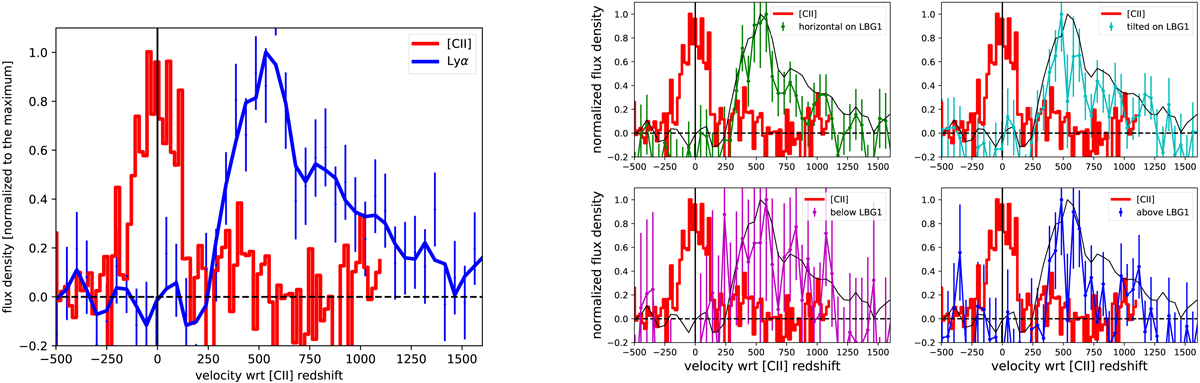
Left panel: 1D profiles of the Lyα (blue) and [C II] (red) emissions toward LBG-1. The [C II] profile is taken from Riechers et al. (2014) and corresponds to the region outlined in Fig. 10 (red contours). Right panel: [C II] profile in red as in the left panel and Lyα profile obtained slicing the Lyα emission horizontally on top of LBG-1 (green), tilted by 110° on top of LBG-1 (cyan), tilted by ten degrees below LBG-1 (magenta), and tilted by ten degrees above LBG-1 (blue). The color coding of these spectra is like in Fig. 12. The two former spectra are the ones with higher signal to noise as can be seen by the smaller error bars. The thin black curve corresponds to the spectrum of the integrated Lyα emission as the blue curve of the left panel.
Current usage metrics show cumulative count of Article Views (full-text article views including HTML views, PDF and ePub downloads, according to the available data) and Abstracts Views on Vision4Press platform.
Data correspond to usage on the plateform after 2015. The current usage metrics is available 48-96 hours after online publication and is updated daily on week days.
Initial download of the metrics may take a while.