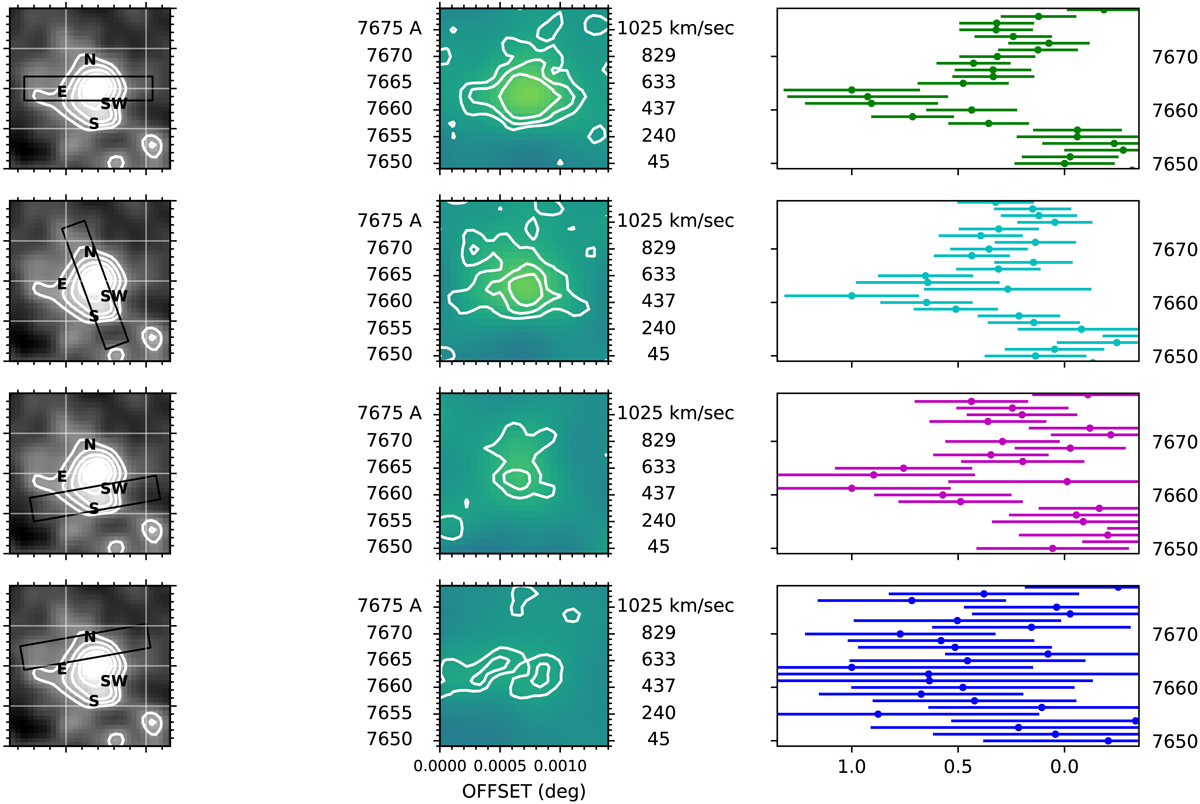
Fig. 12.
Download original image
Left panels: pseudo slits oriented horizontally on the Lyα emission peak (first row), tilted by 110° on the Lyα emission peak (second row), tilted by ten degrees below the Lyα emission peak (third row), and tilted by ten degrees above the Lyα emission peak (fourth row). Middle panels: position-velocity diagrams obtaining slicing the continuum-subtracted MUSE datacube with a pseudo slit oriented as shown in the left panels. In the left y-axis, we indicate the wavelength and in the right y-axis the velocity with respect to the systemic redshift inferred from the [C II] emission line, the x-axis corresponds to the position along the pseudo slit in degrees (from the east to the west, except in the second row where it is from the south to the north). The white contours correspond to the 1, 2, 3σ level. Right panels: 1D spectra corresponding to the position-velocity diagrams of the middle panels. Wavelength is on the y-axis in the same range as in the middle panels and the flux normalized to the maximum is on the x-axis. The color coding of these spectra is like in Fig. 13.
Current usage metrics show cumulative count of Article Views (full-text article views including HTML views, PDF and ePub downloads, according to the available data) and Abstracts Views on Vision4Press platform.
Data correspond to usage on the plateform after 2015. The current usage metrics is available 48-96 hours after online publication and is updated daily on week days.
Initial download of the metrics may take a while.