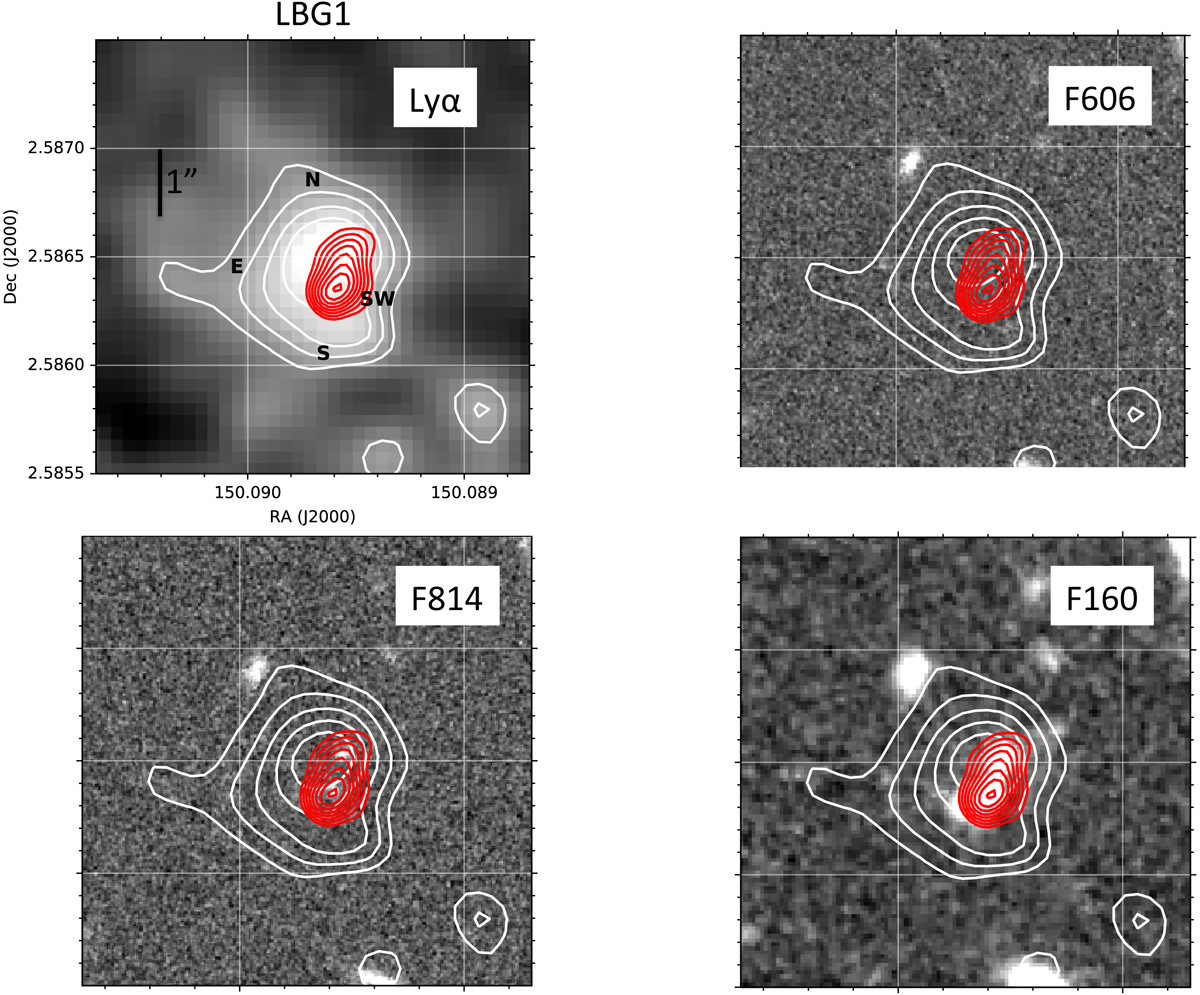
Fig. 10.
Download original image
Upper left: signal-to-noise optimally extracted narrow-band image (Borisova et al. 2016) of the continuum-subtracted Lyα emission, rescaled to surface brightness units, and smoothed using a 2-pixel Gaussian kernel of LBG-1. The five white contours reveal the 0.8 to 2 × 10⁻¹⁸ erg s−1 cm−2 arcsec−2 levels, which correspond to 3 and 8σ in this image. The letters indicate reference positions described in the text. The small black segment indicates the 1″ scale. We also show the Lyα surface brightness contours overplotted to the F606W (upper right), F814W (lower left) ACS, and F160W WFC3 (lower right) HST images. The PSF of our MUSE data is 0.7″, corresponding to about 4 kpc or 27 ckpc at z = 5.3. The eight red contours correspond to the 3−10σ (1σ = 2.38 × 10⁻⁴ Jy beam−1) of the [C II] emission at 301.847−302.093 GHz, corresponding to −120 to 120 km s−1 from the peak emission. The synthesized beam size of the ALMA [C II] observations is 0.63″ × 0.56″ as reported in Riechers et al. (2014).
Current usage metrics show cumulative count of Article Views (full-text article views including HTML views, PDF and ePub downloads, according to the available data) and Abstracts Views on Vision4Press platform.
Data correspond to usage on the plateform after 2015. The current usage metrics is available 48-96 hours after online publication and is updated daily on week days.
Initial download of the metrics may take a while.