Fig. 1
Download original image
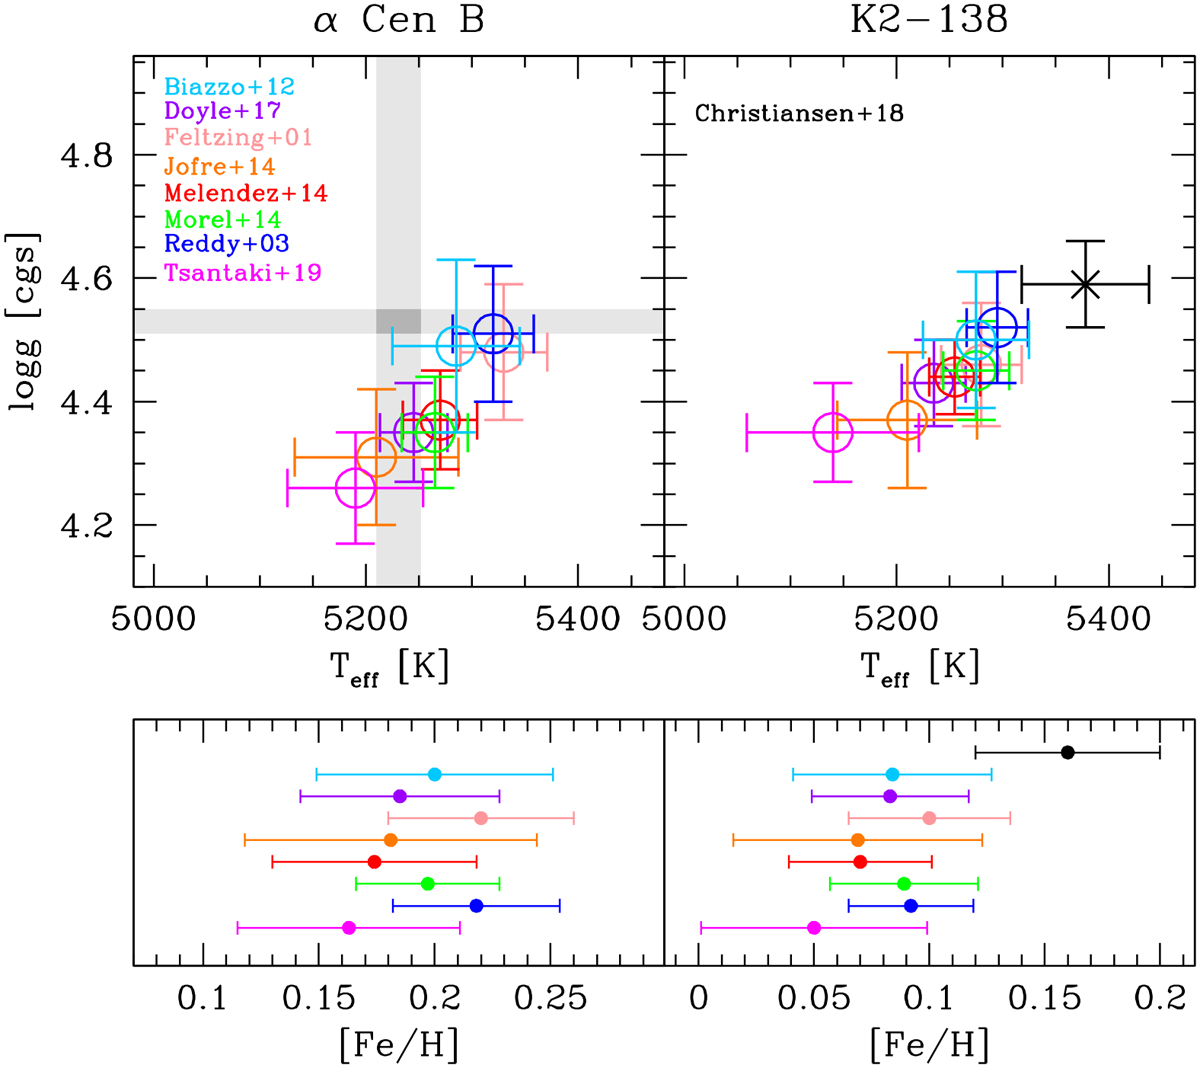
Results of the analysis of α Cen B (left panels) and K2-138 (right panels) using the various iron line lists. The colour coding for each line list is indicated in the upper left panel. The parameters of K2-138 determined by Christiansen et al. (2018) are shown in the right panels. The grey-shaded areas for α Cen B delimit the interferometric Teff and seismic log g values (± 1 σ; see Sect. 2.1 for details).
Current usage metrics show cumulative count of Article Views (full-text article views including HTML views, PDF and ePub downloads, according to the available data) and Abstracts Views on Vision4Press platform.
Data correspond to usage on the plateform after 2015. The current usage metrics is available 48-96 hours after online publication and is updated daily on week days.
Initial download of the metrics may take a while.