Fig. 6.

Download original image
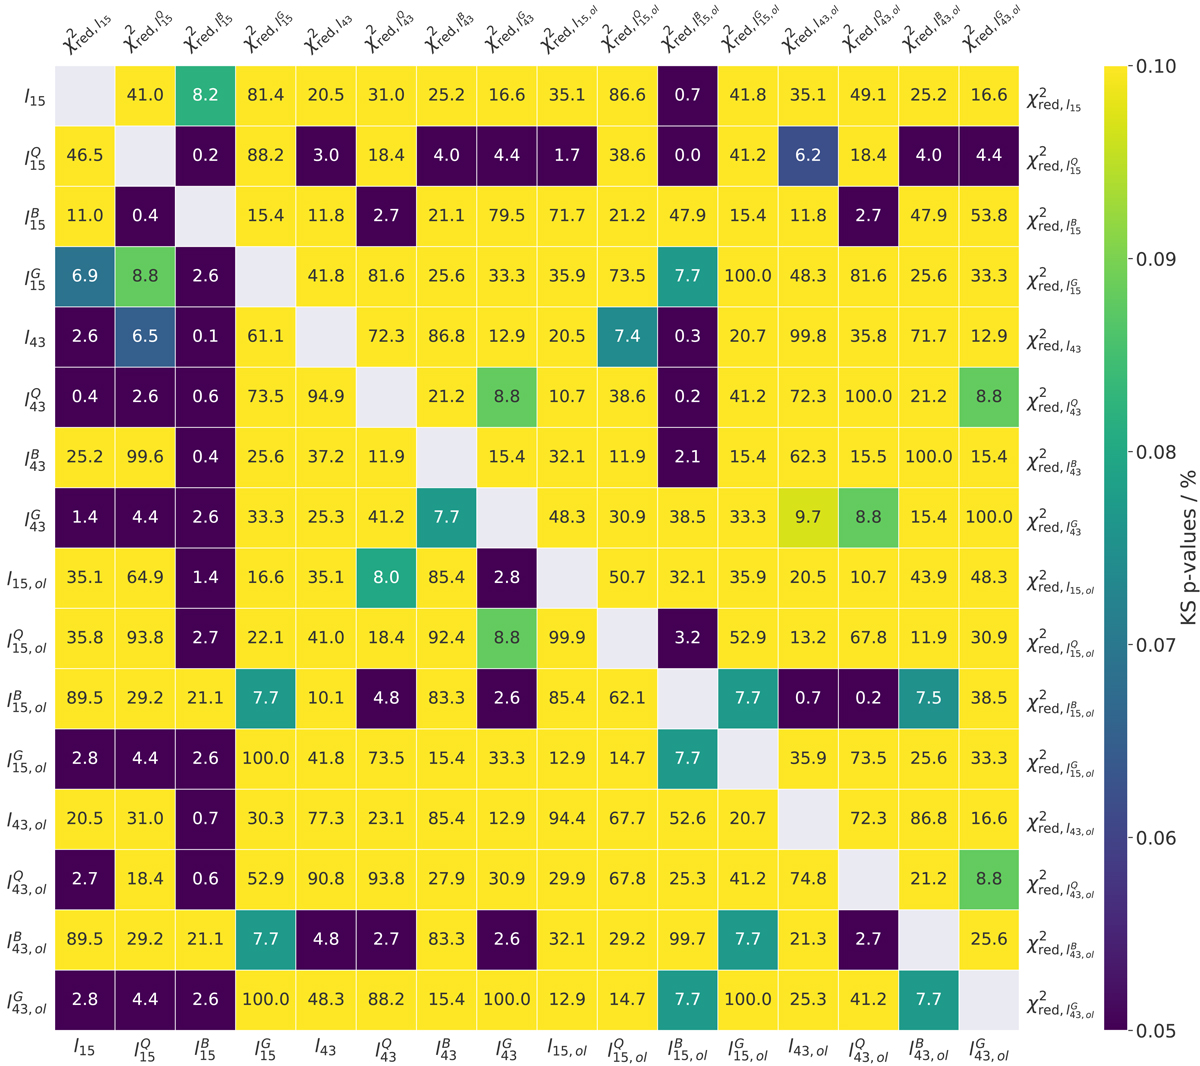
P-values for each pair of parameters involving the jet geometry compared with the two-sided KS test. The fields are color coded ranging from p < 5% (dark blue) to p ≥ 10% (yellow). The lower triangle, where all l values are compared and the upper triangle where all ![]() -values are compared, in the plot have to be read separately. The indices (Q, B, G) denote FSRQs, BL Lacs and radio galaxies, respectively. The index “ol” denotes values that are calculated in the overlap region in contrast to the entire jet length. These were introduced in order to make the plots more readable.
-values are compared, in the plot have to be read separately. The indices (Q, B, G) denote FSRQs, BL Lacs and radio galaxies, respectively. The index “ol” denotes values that are calculated in the overlap region in contrast to the entire jet length. These were introduced in order to make the plots more readable.
Current usage metrics show cumulative count of Article Views (full-text article views including HTML views, PDF and ePub downloads, according to the available data) and Abstracts Views on Vision4Press platform.
Data correspond to usage on the plateform after 2015. The current usage metrics is available 48-96 hours after online publication and is updated daily on week days.
Initial download of the metrics may take a while.


