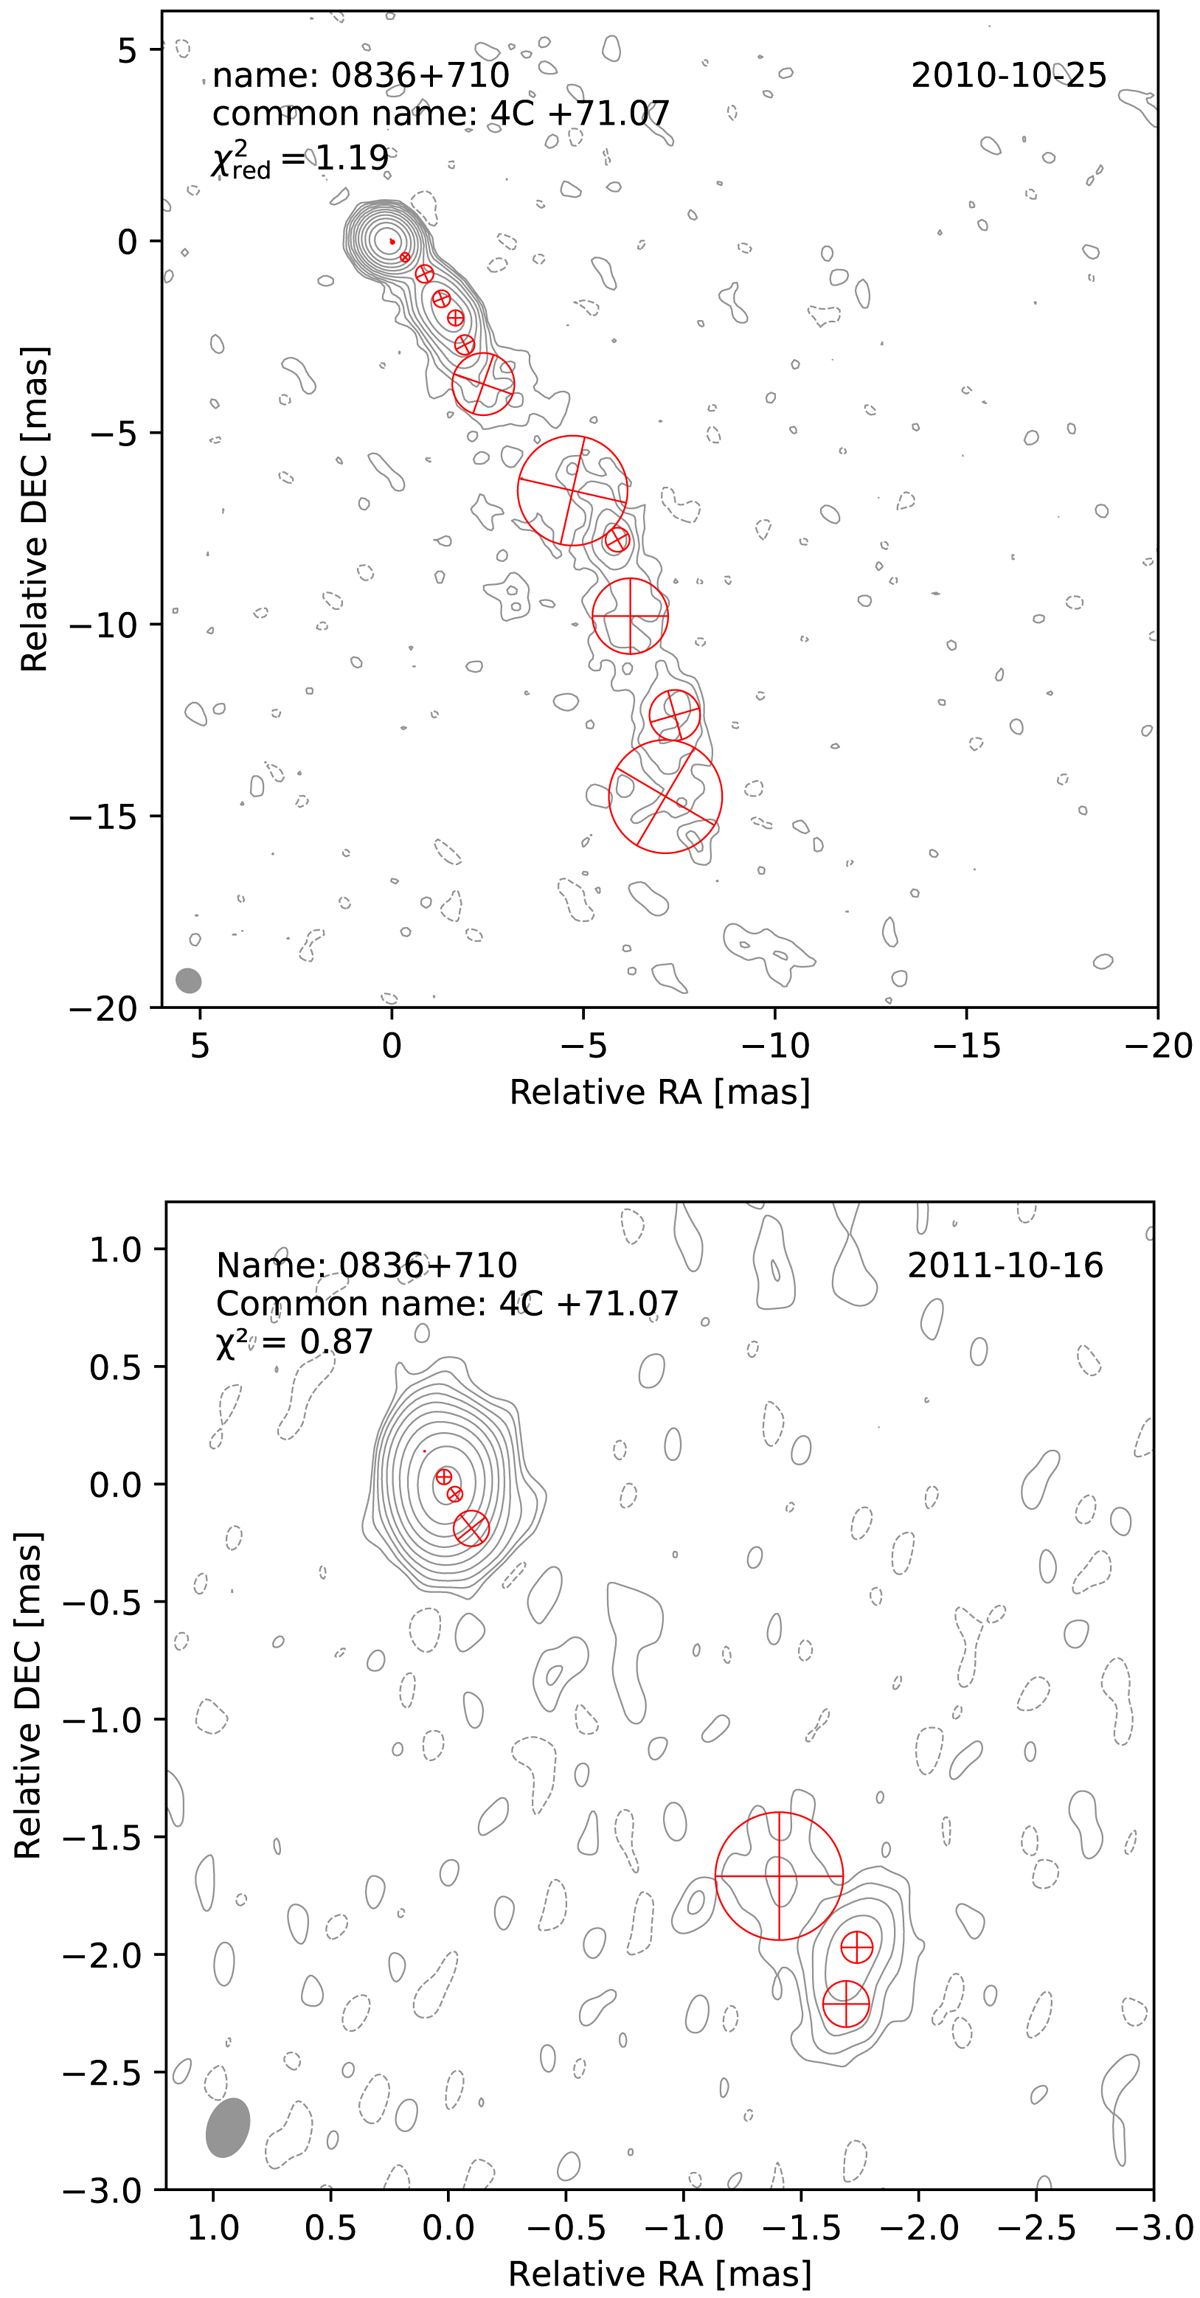
Fig. 1.
Download original image
Fitted Gaussian-component representation of 4C +71.07 (0836+710) at 15 GHz (top) and at 43 GHz (bottom). The contours for both frequencies are shown at a 5σ level and are separated by a factor of 2. In the 15 GHz image the map noise level is ∼0.2 mJy. The contour levels are [−0.85,0.85,1.7,3.4,6.7, 13.7,27.5,54.9,109.8,219.6,430.2,878.5] mJy). At 43 GHz the map noise level is ∼0.8 mJy. The contour levels are [−3.8,3.8,7.5, 15.1,30.2,60.3,120.6,241.2,284.5,482.5,964.9, 1929.8, 3859.6] mJy.
Current usage metrics show cumulative count of Article Views (full-text article views including HTML views, PDF and ePub downloads, according to the available data) and Abstracts Views on Vision4Press platform.
Data correspond to usage on the plateform after 2015. The current usage metrics is available 48-96 hours after online publication and is updated daily on week days.
Initial download of the metrics may take a while.