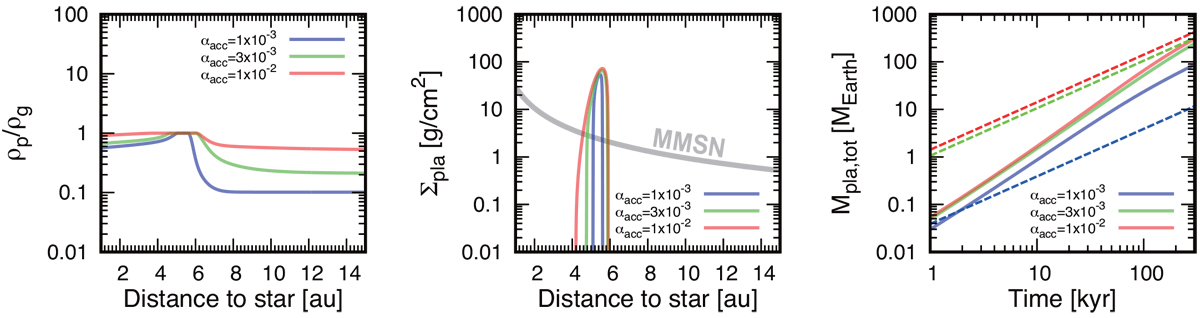
Fig. 7
Download original image
Same as Fig. 6, but for different αacc (blue for αacc = 1 × 10⁻³, green for αacc = 3 × 10⁻³, and red for αacc = 1 × 10⁻², respectively). Here, Disk 2, τs = 0.01, Ṁg = 10−8M⊙ yr−1, Fp/g = 0.47, and kSI = 10−3 are used. A large deviation between the analytical estimation (blue dashed line) and the simulation (blue solid line) for αacc = 1 × 10⁻³ is seen in the right panel (see texts for the potential reason).
Current usage metrics show cumulative count of Article Views (full-text article views including HTML views, PDF and ePub downloads, according to the available data) and Abstracts Views on Vision4Press platform.
Data correspond to usage on the plateform after 2015. The current usage metrics is available 48-96 hours after online publication and is updated daily on week days.
Initial download of the metrics may take a while.