Fig. 5
Download original image
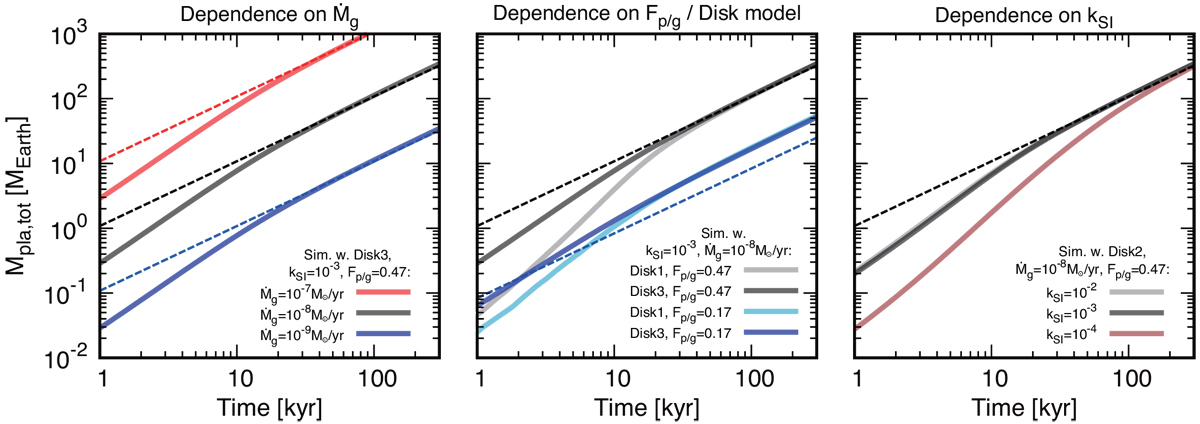
Cumulative mass of planetesimals, Mpla,tot, formed by the ND mechanism as a function of time. The thin dashed lines are analytically derived cumulative masses of planetesimals (Eq. (13)). The thick solid lines are the results of numerical simulations. Here, we sorted numerical data so that planetesimal formation starts at t = 0 kyr (i.e., the time at which ρd/ρg exceeds 1, which should depend on the parameters in the numerical simulations, is always shifted to t = 0 kyr). Left panel: dependence on Ṁg where Ṁg(= 10−7, 10−8, and 10−9 M⊙ yr−1) are a variable while the disk structure (Disk 3) and Fp/g = 0.47 are kept the same. Middle panel: dependence on disk structure and Fp/g where disk structure (Disk 1 or Disk 3; see Table 1) and Fp/g(= 0.17 or 0.47) are variables while keeping the same Ṁg = 10−8 M⊙ yr−1. Right panel: dependence on kSI where kSI = 10−2,10−3, and 10−4 while having the same disk structure (Disk 2), Fp/g = 0.47, and Ṁg = 10−8 M⊙ yr−1. After around ~10–100 kyr, depending on the parameters, the rate of planetesimal formation can be described by the analytical arguments (dashed lines); that is, the system reaches a steady width of the planetesimal belt (Sect. 3.6). In this study, Fp/g is kept constant (i.e., infinite solid mass budget). We note, however, that the maximum total mass of planetesimals in a real system should be regulated by the mass budget of solids (see Sect. 3.6). Here, αacc = 10−2 and τs = 0.1 are used.
Current usage metrics show cumulative count of Article Views (full-text article views including HTML views, PDF and ePub downloads, according to the available data) and Abstracts Views on Vision4Press platform.
Data correspond to usage on the plateform after 2015. The current usage metrics is available 48-96 hours after online publication and is updated daily on week days.
Initial download of the metrics may take a while.