Fig. 3
Download original image
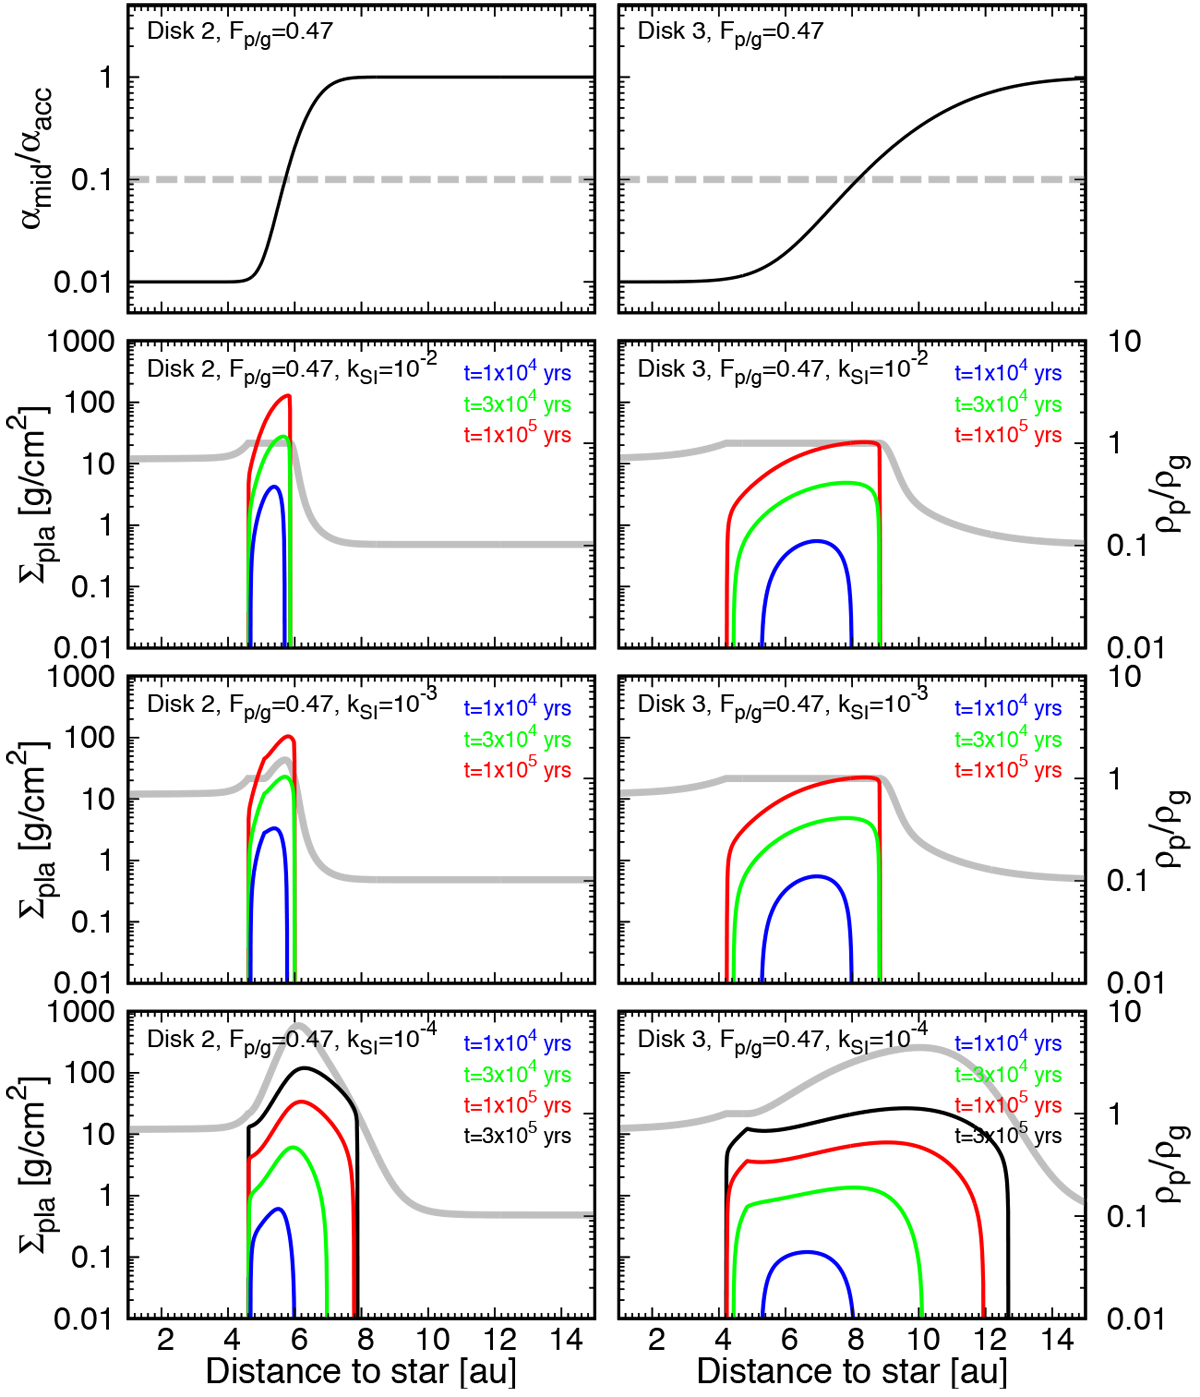
Dependence of the resultant planetesimal belt on kSI. Left and right panels: cases of different given disk structures (Disk 2 and Disk 3, respectively; Table 1). Top panels: given disk structures. Bottom three panels: the same combination of Fp/g and the disk structure but different kSI. The dashed gray lines in the top panels show the analytically derived critical αmid/αacc for a given Fp/g, indicating that disks having smaller αmid/αacc than the critical one are expected to develop the ND mode (no dependence on kSI; Eq. (11)). The blue, green, red, and black lines represent time evolution. By t ≃ 3 x 10⁵ years, all cases reach a steady-state in ρp/ρg and the planetesimals keep forming in a ring with a constant width. The gray lines represent the midplane pebble-togas ratio, ρp/ρg, at the steady-state shown in the right axis. Here, τs = 0.1 and Mg = 10−8 M⊙ yr−1 are used.
Current usage metrics show cumulative count of Article Views (full-text article views including HTML views, PDF and ePub downloads, according to the available data) and Abstracts Views on Vision4Press platform.
Data correspond to usage on the plateform after 2015. The current usage metrics is available 48-96 hours after online publication and is updated daily on week days.
Initial download of the metrics may take a while.