Fig. 2
Download original image
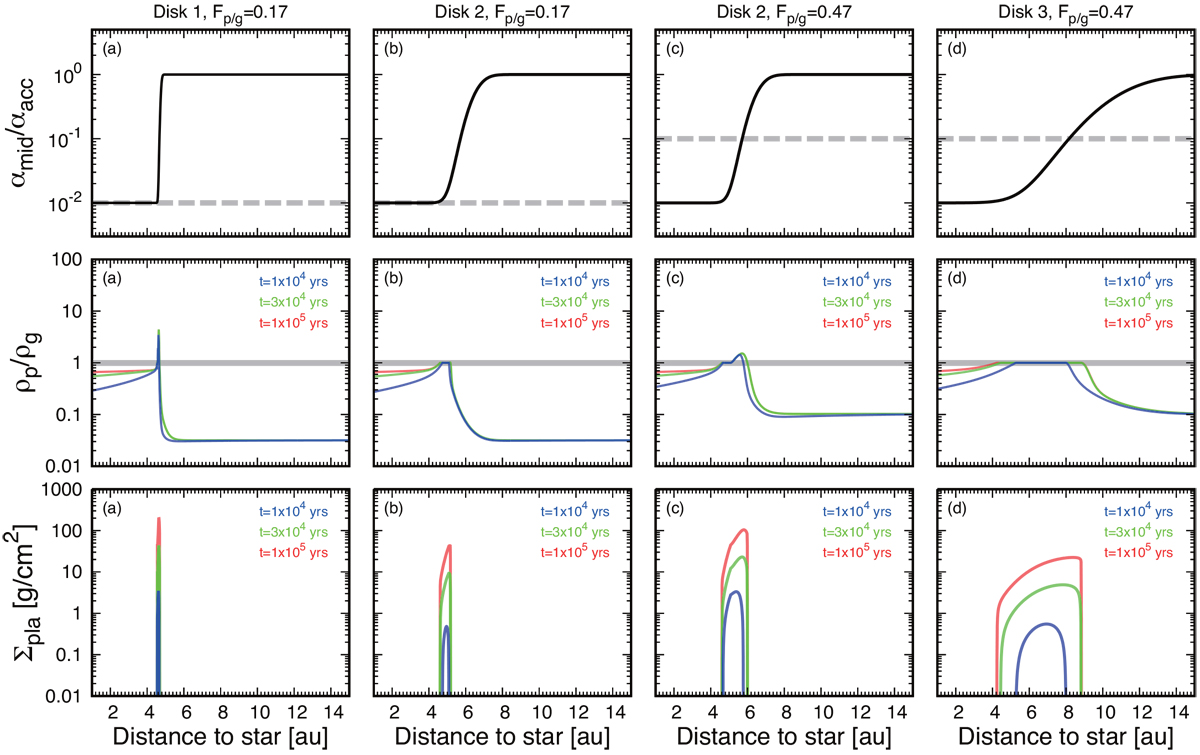
Overall results of our numerical simulations for different combinations of the disk structure and Fp/g. Top panels: given disk structures (the black lines; see Table 1). Middle panels: resultant midplane pebble-to-gas ratio of the spatial density, ρp/ρg. Bottom panels: resultant planetesimal surface density formed by the ND mode and SI (Eq. (8)). The blue, green, and red lines indicate time evolution. By t ≃ 1 × 10⁵ yr, the system reaches a steady-state in ρp/ρg and then planetesimals keep forming in a steady width. The dashed gray lines in the top panels represent analytically derived critical αmid/αacc for a given Fp/g (Eq. (11)), indicating that disks of smaller αmid/αacc than this critical value develop the ND mode. The gray lines in the middle panels represent the critical ρp/ρg above which the ND mode occurs (i.e., ρp/ρg = 1). Here, αacc = 10−2, τs = 0.1, Mg = 10−8 M⊙ yr−1, and kSI = 10−3 are used.
Current usage metrics show cumulative count of Article Views (full-text article views including HTML views, PDF and ePub downloads, according to the available data) and Abstracts Views on Vision4Press platform.
Data correspond to usage on the plateform after 2015. The current usage metrics is available 48-96 hours after online publication and is updated daily on week days.
Initial download of the metrics may take a while.