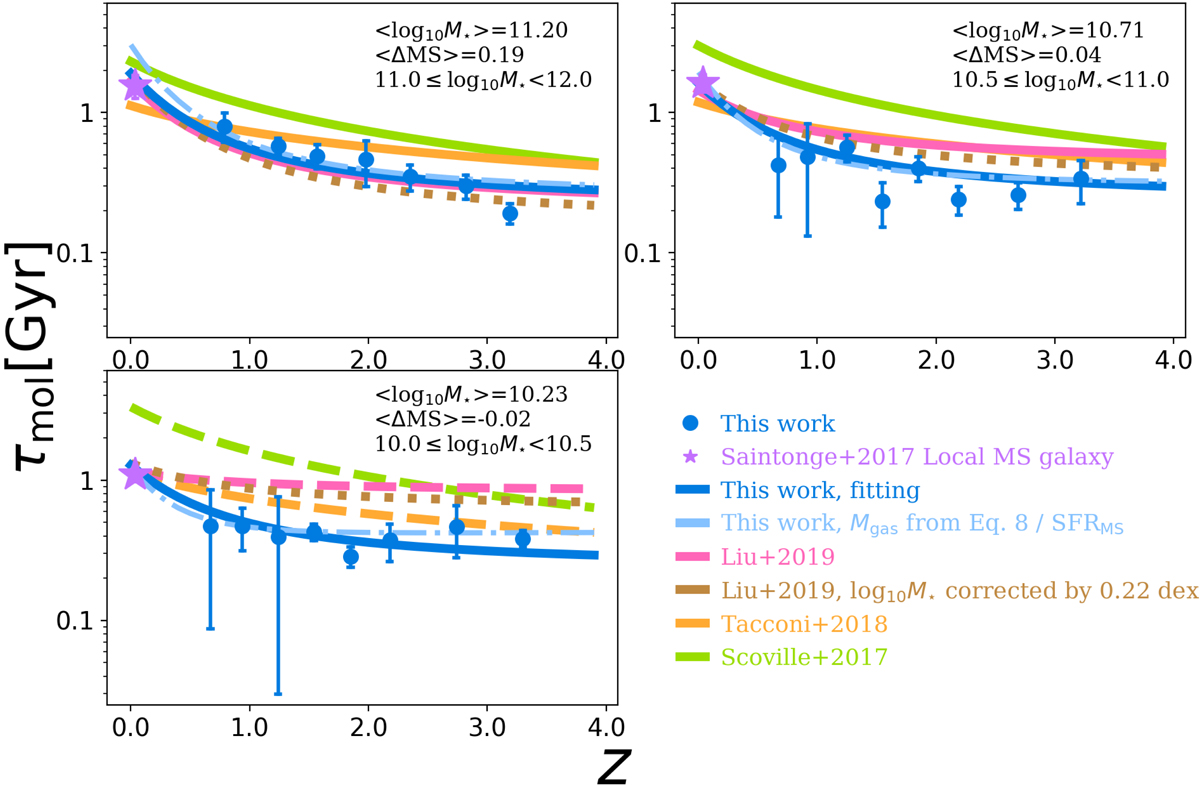
Fig. 7.
Download original image
Redshift evolution of the molecular gas depletion time of MS galaxies in three stellar mass bins, i.e., 1011 ≤ M⋆/M⊙ < 1012, 1010.5 ≤ M⋆/M⊙ < 1011, and 1010 ≤ M⋆/M⊙ < 1010.5. Blue circles show our uv-domain molecular gas mass measurements divided by the mean SFR of each of these stacked samples. Purple stars show the local MS reference taken from Saintonge et al. (2017). Lines present the analytical evolution of the molecular gas depletion time as inferred from our work (blue lines; see text for details), from Liu et al. (2019b, pink line), from Scoville et al. (2017, green line), and from Tacconi et al. (2020, orange line). In our lower stellar mass bin, lines from the literature are dashed as they mostly rely on extrapolations.
Current usage metrics show cumulative count of Article Views (full-text article views including HTML views, PDF and ePub downloads, according to the available data) and Abstracts Views on Vision4Press platform.
Data correspond to usage on the plateform after 2015. The current usage metrics is available 48-96 hours after online publication and is updated daily on week days.
Initial download of the metrics may take a while.