Fig. 5.
Download original image
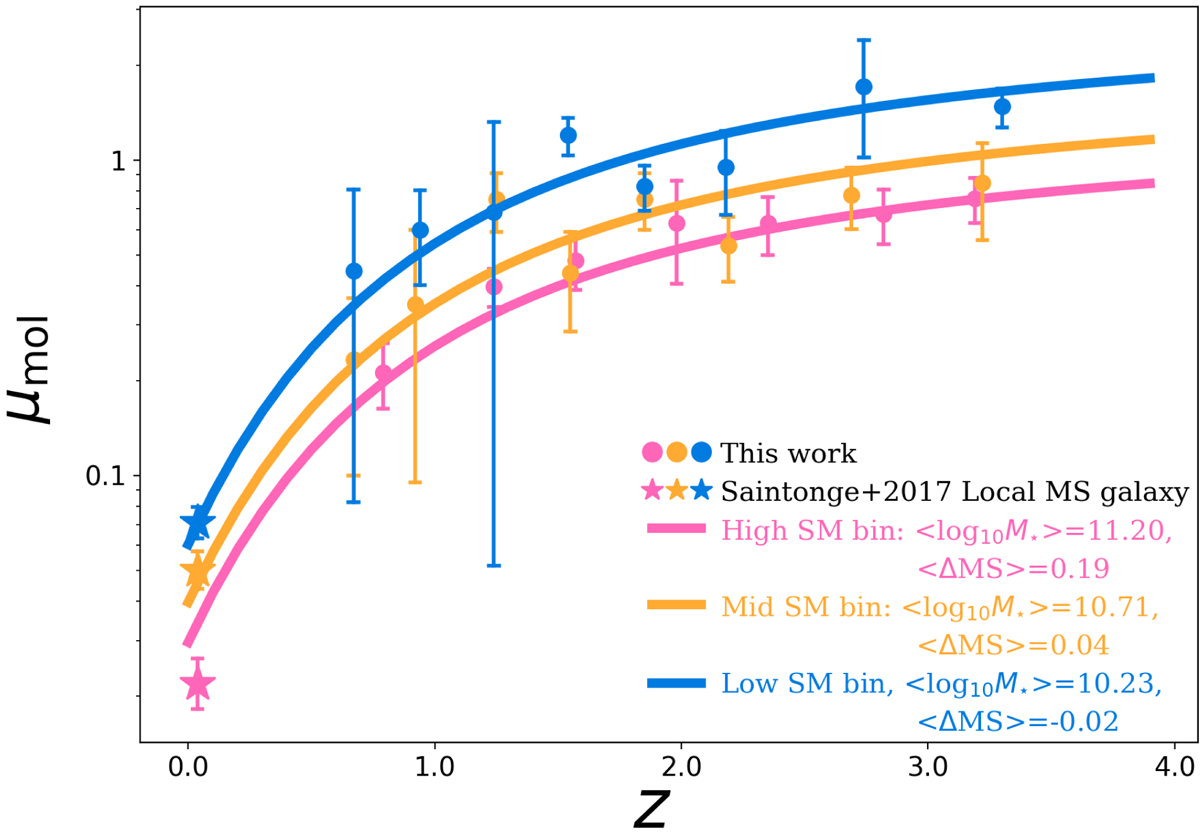
Redshift evolution of the mean molecular gas fraction of MS galaxies. Circles show the mean molecular gas fraction from our work. Stars present the local reference taken from Saintonge et al. (2017). Lines display the analytical evolution of the molecular gas fraction inferred from our work. Symbols and lines are color-coded by stellar mass, i.e., pink for 1011 ≤ M⋆/M⊙ < 1012, orange for 1010.5 ≤ M⋆/M⊙ < 1011, and blue for 1010 ≤ M⋆/M⊙ < 1010.5.
Current usage metrics show cumulative count of Article Views (full-text article views including HTML views, PDF and ePub downloads, according to the available data) and Abstracts Views on Vision4Press platform.
Data correspond to usage on the plateform after 2015. The current usage metrics is available 48-96 hours after online publication and is updated daily on week days.
Initial download of the metrics may take a while.