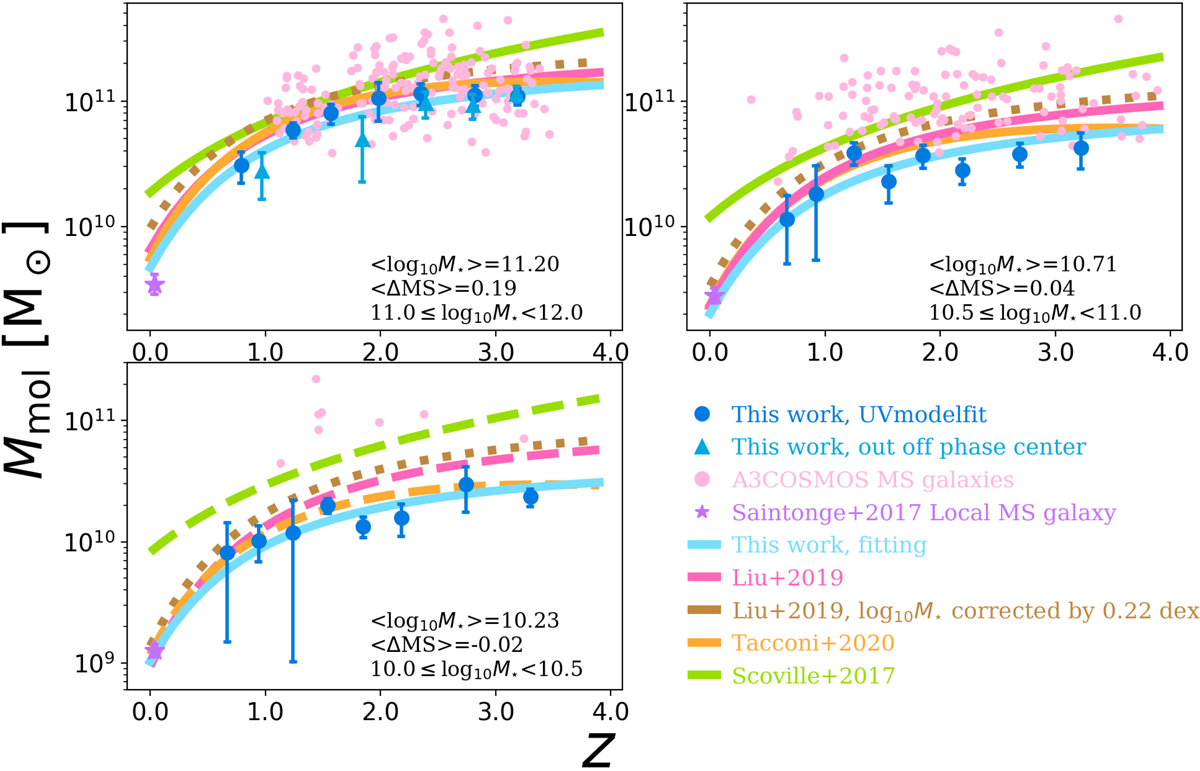
Fig. 4.
Download original image
Redshift evolution of the mean molecular gas mass of MS galaxies in three stellar mass bins, i.e., 1011 ≤ M⋆/M⊙ < 1012, 1010.5 ≤ M⋆/M⊙ < 1011, and 1010 ≤ M⋆/M⊙ < 1010.5. Blue circles show our uv-domain measurements, while in the highest stellar mass bin blue triangles show those obtained after excluding ALMA primary-target galaxies from our stacked sample (see Sect. 2.2). Pink circles are individually detected MS galaxies taken from the A3COSMOS catalog (Liu et al. 2019b), while purple stars present the local reference taken from Saintonge et al. (2017). Lines show the analytical evolution of the gas fraction as inferred from our work (blue), from Scoville et al. (2017, green), from Liu et al. (2019b, pink), from Tacconi et al. (2020, orange), and from Liu et al. (2019b, dotted brown line) but this time accounting for the systematic 0.22 dex offset observed between their and our stellar mass estimates. In our lower stellar mass bin, lines from the literature are dashed as they mostly rely on extrapolations. We note that here and in all following figures, the values of ⟨M⋆⟩ and ⟨ΔMS⟩ given in each panel are simply used to plot the analytical evolution of the gas fraction. These values naturally vary for each stacked measurements and are accounted for by our MCMC analysis. This avoids averaging biases that could arise if one simply fit our stacked measurements using ⟨tcosmic⟩, ⟨M⋆⟩, and ⟨ΔMS⟩.
Current usage metrics show cumulative count of Article Views (full-text article views including HTML views, PDF and ePub downloads, according to the available data) and Abstracts Views on Vision4Press platform.
Data correspond to usage on the plateform after 2015. The current usage metrics is available 48-96 hours after online publication and is updated daily on week days.
Initial download of the metrics may take a while.