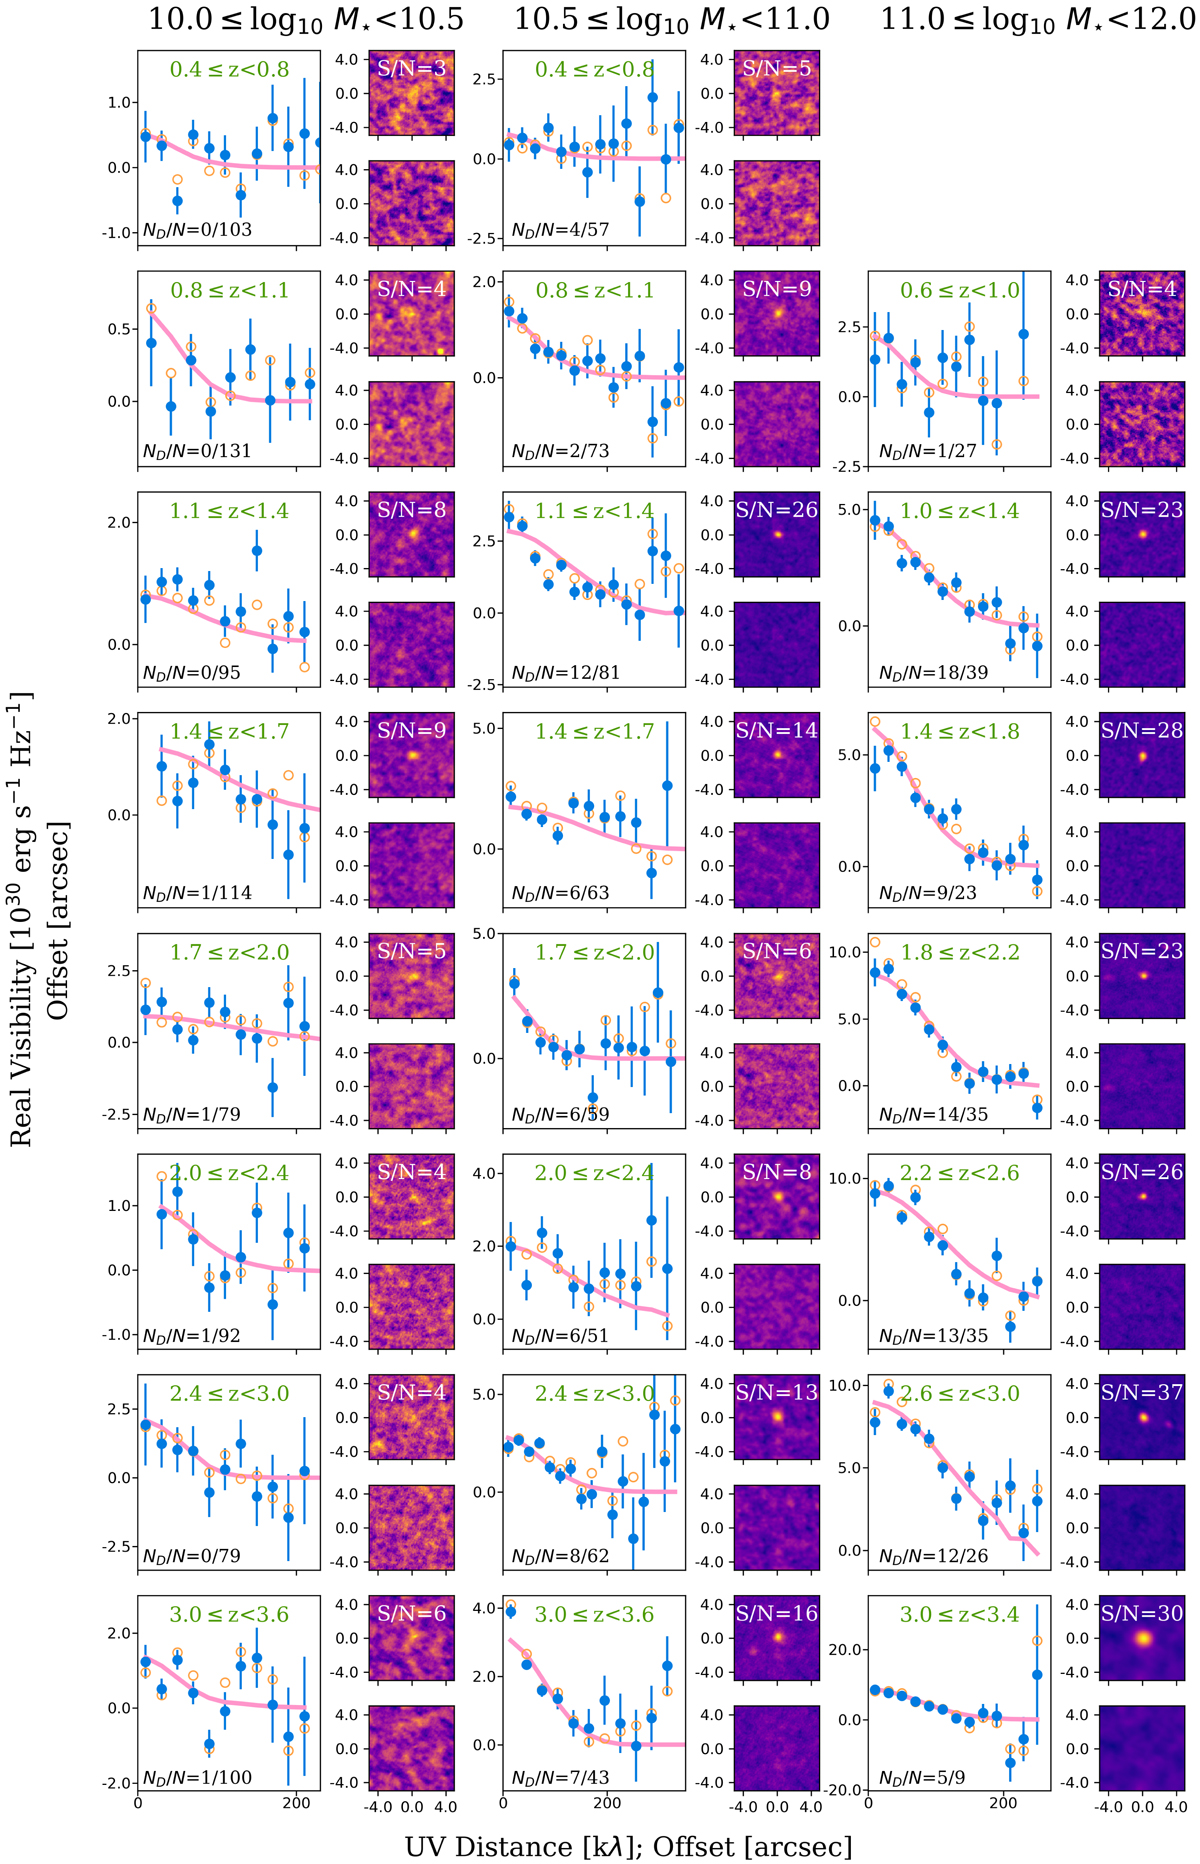
Fig. 3.
Download original image
Results of our stacking analysis for MS galaxies in the uv and image domain. For each stellar mass–redshift bin, the left panel shows the single component model (solid pink line) fitted to the (stacked) mean visibility amplitudes (filled blue circles) using the CASA task uvmodelfit. Open orange circles show the median visibility amplitudes, which are consistent, within the uncertainties, with the mean visibility amplitudes. The top-right and bottom-right panels show, respectively, the stacked and residual images, the latter being obtained by subtracting from the former the single 2D Gaussian component fitted by PyBDSF. The number of individually detected galaxies (ND) and the number of stacked galaxies (N) in each stellar mass–redshift bin is reported in the left panel (i.e., ND/N), while the detection significance i.e., S/Npeak, is reported in the upper-right panel.
Current usage metrics show cumulative count of Article Views (full-text article views including HTML views, PDF and ePub downloads, according to the available data) and Abstracts Views on Vision4Press platform.
Data correspond to usage on the plateform after 2015. The current usage metrics is available 48-96 hours after online publication and is updated daily on week days.
Initial download of the metrics may take a while.