Fig. 2.
Download original image
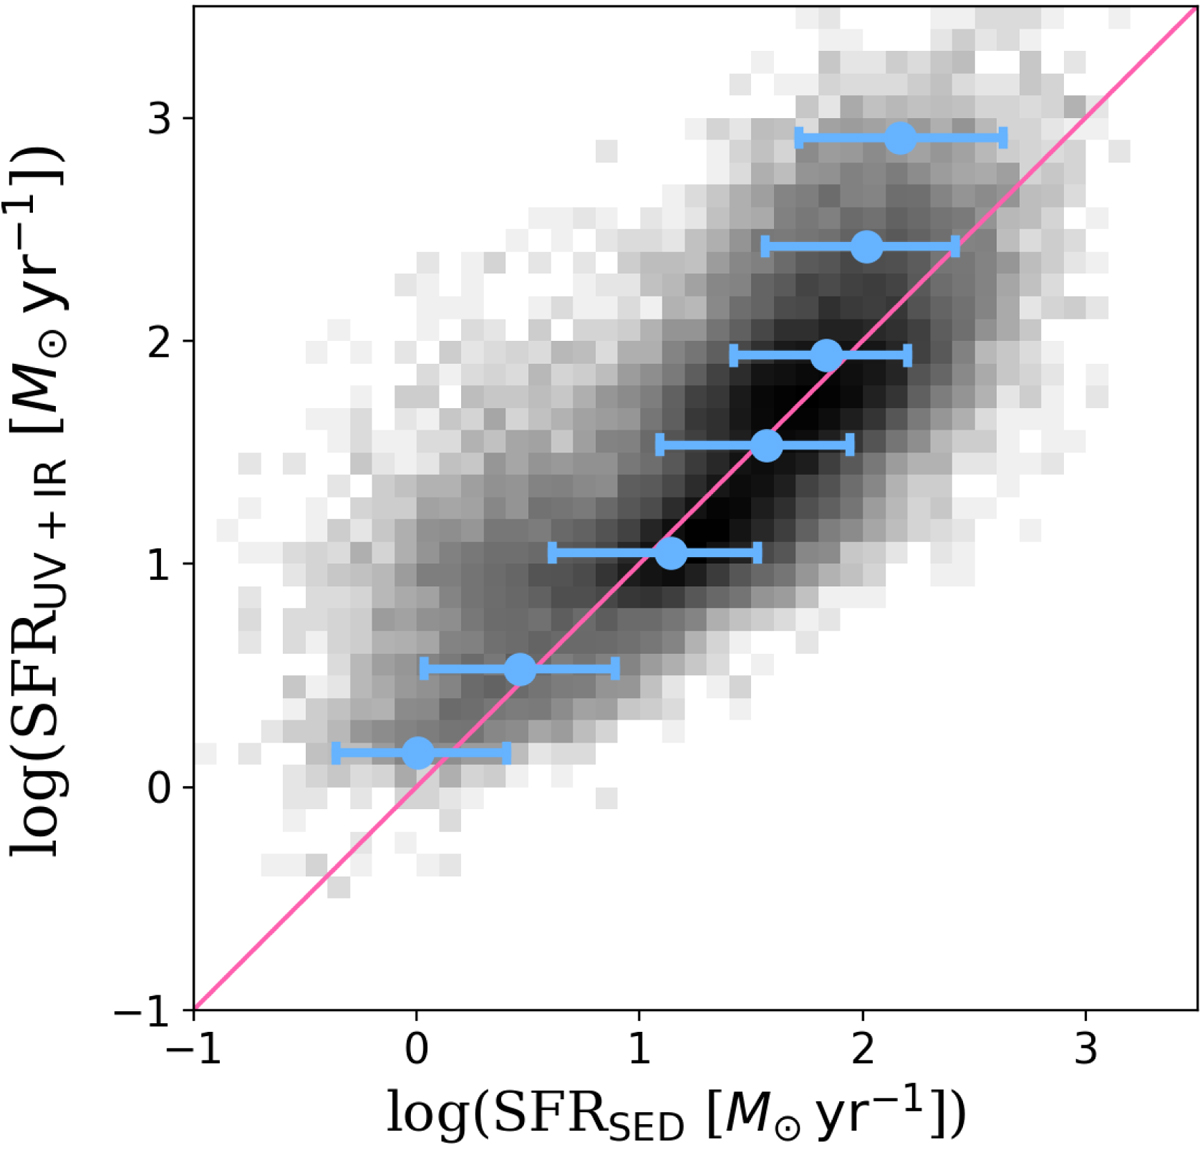
Comparison of the SFRs obtained from the COSMOS-2015 catalog, i.e., SFRSED, to the SFRs obtained from the ladder of SFR, i.e., SFRUV + IR. Number densities are displayed in log-scale. Blue circles represent the median value of log(SFRSED) in log(SFRUV + IR) bins, starting from −0.25 dex and with a bin size of 0.5 dex. Error bars correspond to the 16th and 84th percentiles. The pink line is the one-to-one relation.
Current usage metrics show cumulative count of Article Views (full-text article views including HTML views, PDF and ePub downloads, according to the available data) and Abstracts Views on Vision4Press platform.
Data correspond to usage on the plateform after 2015. The current usage metrics is available 48-96 hours after online publication and is updated daily on week days.
Initial download of the metrics may take a while.