Fig. B.2.
Download original image
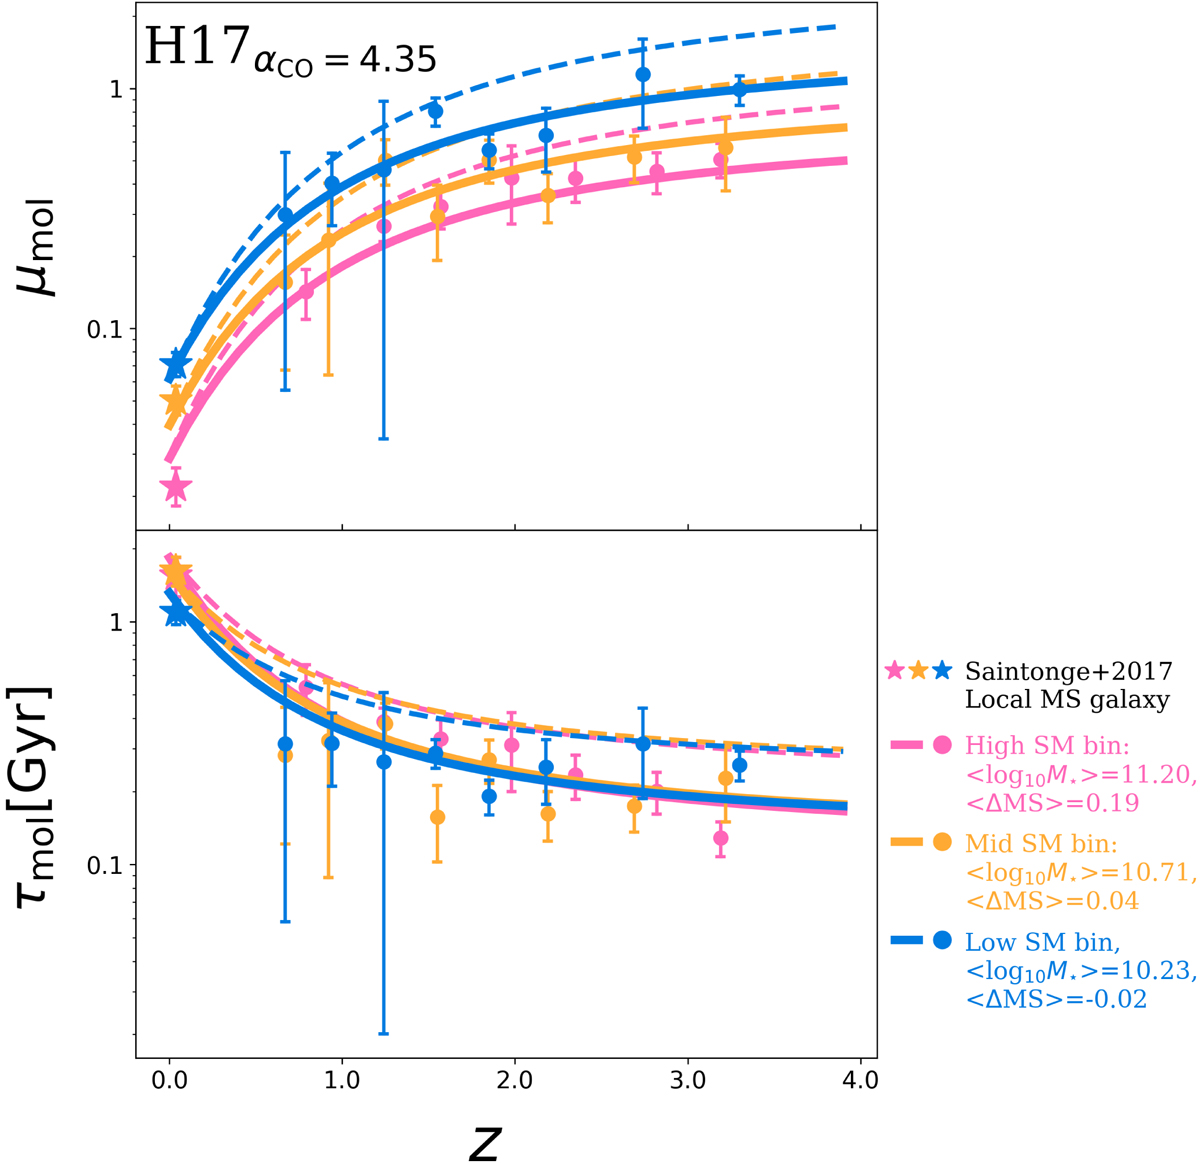
Redshift evolution of the mean molecular gas fraction and molecular gas depletion time of MS galaxies, with the Mgas from the H17αCO = 4.35 gas mass calibration. Dots show the mean molecular gas fraction and molecular gas depletion time from our work. Stars represent the local reference taken from Saintonge et al. (2017). Solid lines display the analytical evolution of the molecular gas fraction and molecular gas depletion time inferred with the H17αCO = 4.35 gas mass calibration. Dashed lines show the analytical evolution of the molecular gas fraction and molecular gas depletion time inferred with the H17 gas mass calibration (used throughout the paper). Symbols and lines are color-coded by stellar mass.
Current usage metrics show cumulative count of Article Views (full-text article views including HTML views, PDF and ePub downloads, according to the available data) and Abstracts Views on Vision4Press platform.
Data correspond to usage on the plateform after 2015. The current usage metrics is available 48-96 hours after online publication and is updated daily on week days.
Initial download of the metrics may take a while.