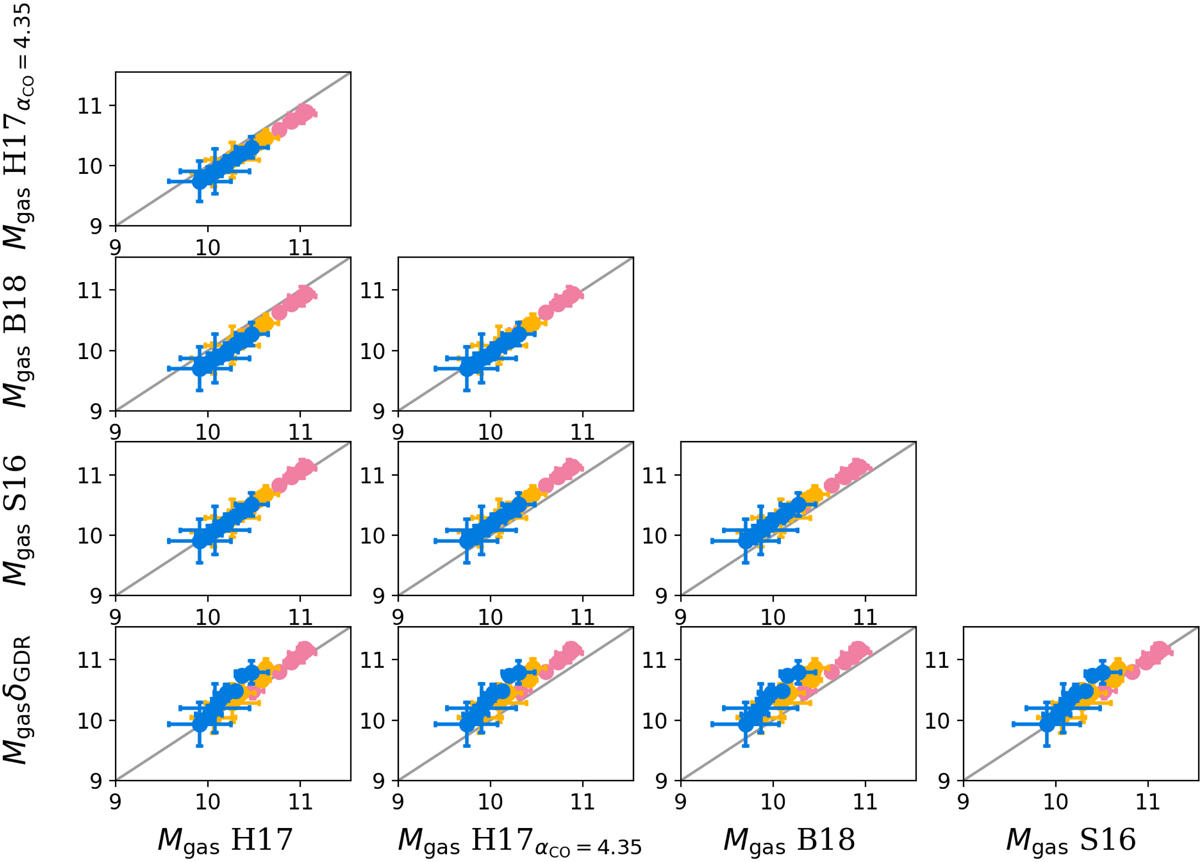
Fig. B.1.
Download original image
Comparisons between four molecular gas mass calibrations, i.e., from Hughes et al. (2017) assuming αCO = 6.5 (H17; used throughout our paper), Hughes et al. (2017) assuming αCO = 4.35 (H17αCO = 4.35), Scoville et al. (2016, S16), Bertemes et al. (2018, B18), and Leroy et al. (2011, δGDR). In each panel, the solid gray line is the one-to-one relation. Symbol colors have the same meaning as in Fig. 11.
Current usage metrics show cumulative count of Article Views (full-text article views including HTML views, PDF and ePub downloads, according to the available data) and Abstracts Views on Vision4Press platform.
Data correspond to usage on the plateform after 2015. The current usage metrics is available 48-96 hours after online publication and is updated daily on week days.
Initial download of the metrics may take a while.