Fig. 11.
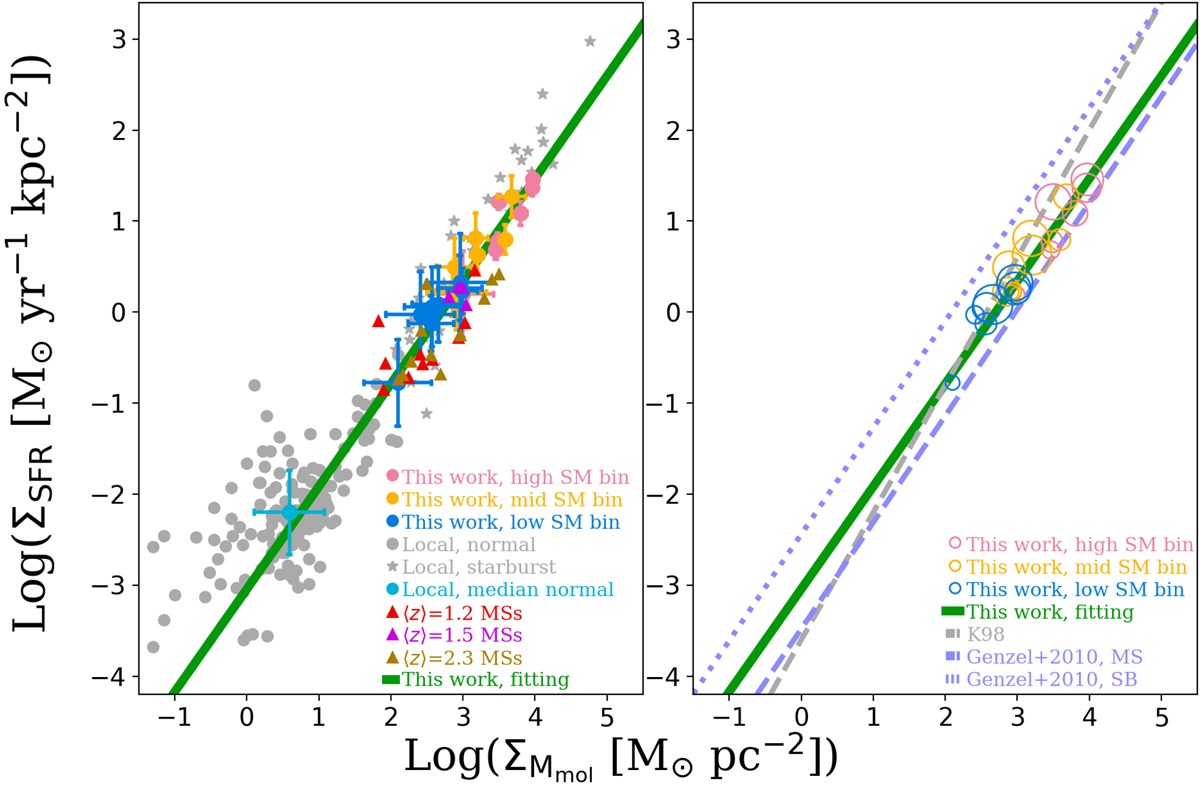
Download original image
Relation between the SFR and gas mass densities of SFGs, i.e., the so-called KS relation. Left: our stacking results for our high, mid, and low stellar mass bins, i.e., 1011 ≤ M⋆/M⊙ < 1012, 1010.5 ≤ M⋆/M⊙ < 1011, and 1010 ≤ M⋆/M⊙ < 1010.5, respectively, shown by pink, orange, and blue circles. Gray circles and stars are normal and starburst local galaxies from K98 and de los Reyes & Kennicutt (2019, taking only their molecular gas mass estimates, i.e., excluding the atomic phase). Red, purple, and brown triangles are ⟨z⟩ = 1.2 (Daddi et al. 2010), ⟨z⟩ = 1.5 (Davis et al. 2007; Noeske et al. 2007; Tacconi et al. 2010), and ⟨z⟩ = 2.3 (Erb et al. 2006) MS galaxies, respectively. The green line is a fit to the KS relation considering only MS galaxies, i.e., our measurements together with the K98 normal local galaxy average (turquoise dot). Right: comparison of our MS-only KS relation to the global fit of K98, the MS-only (long dashed blue line) and starburst-only (dotted blue line) fits of Genzel et al. (2010). Open circles show our measurements, with symbol size increasing with redshift and color-coded by stellar masses.
Current usage metrics show cumulative count of Article Views (full-text article views including HTML views, PDF and ePub downloads, according to the available data) and Abstracts Views on Vision4Press platform.
Data correspond to usage on the plateform after 2015. The current usage metrics is available 48-96 hours after online publication and is updated daily on week days.
Initial download of the metrics may take a while.