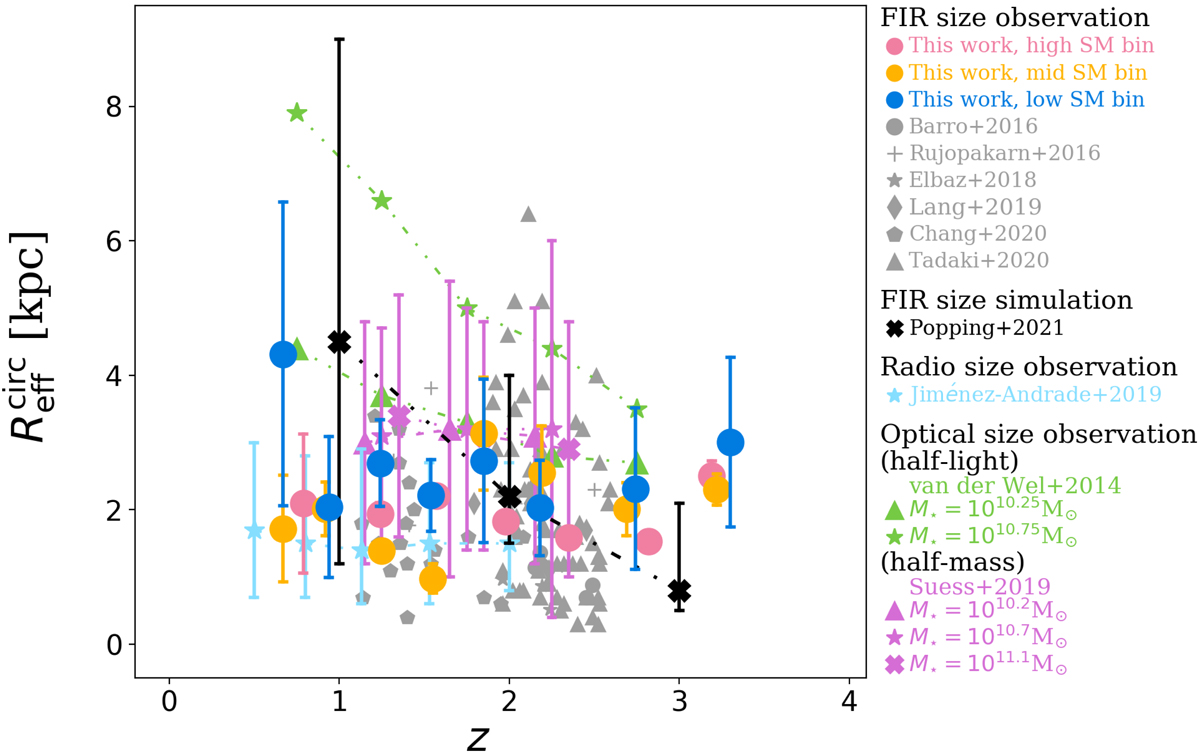
Fig. 10.
Download original image
Redshift evolution of the half-light (or half-mass) radius of MS galaxies. Pink, orange, and blue circles present our stacking results for our high, mid, and low stellar mass bins, i.e., 1011 ≤ M⋆/M⊙ < 1012, 1010.5 ≤ M⋆/M⊙ < 1011, and 1010 ≤ M⋆/M⊙ < 1010.5, respectively. The gray data points are the FIR sizes of MS galaxies from Barro et al. (2016, dots), Rujopakarn et al. (2016, pluses), Elbaz et al. (2018, stars), Lang et al. (2019, diamonds), Chang et al. (2020, pentagons), and Tadaki et al. (2020, triangles); light blue stars are radio sizes of MS galaxies from Jiménez-Andrade et al. (2019). The black crosses are the FIR sizes of M⋆ = 1010.5 M⊙ MS galaxies from the simulations of Popping et al. (2022). The green triangles and stars are the optical half-light sizes of M⋆ = 1010.25 M⊙ and M⋆ = 1011.25 M⊙ MS galaxies from van der Wel et al. (2014). Finally, the purple triangles, stars, and crosses are the optical half-mass sizes of M⋆ = 1010.25 M⊙, M⋆ = 1010.75 M⊙, and M⋆ = 1011.25 M⊙ MS galaxies from Suess et al. (2019). Because most of these literature studies relied on image-plane fits, the stacked FIR sizes displayed here are those from our 2D Gaussian image-plane fits done using PyBDSF.
Current usage metrics show cumulative count of Article Views (full-text article views including HTML views, PDF and ePub downloads, according to the available data) and Abstracts Views on Vision4Press platform.
Data correspond to usage on the plateform after 2015. The current usage metrics is available 48-96 hours after online publication and is updated daily on week days.
Initial download of the metrics may take a while.