Fig. 1.
Download original image
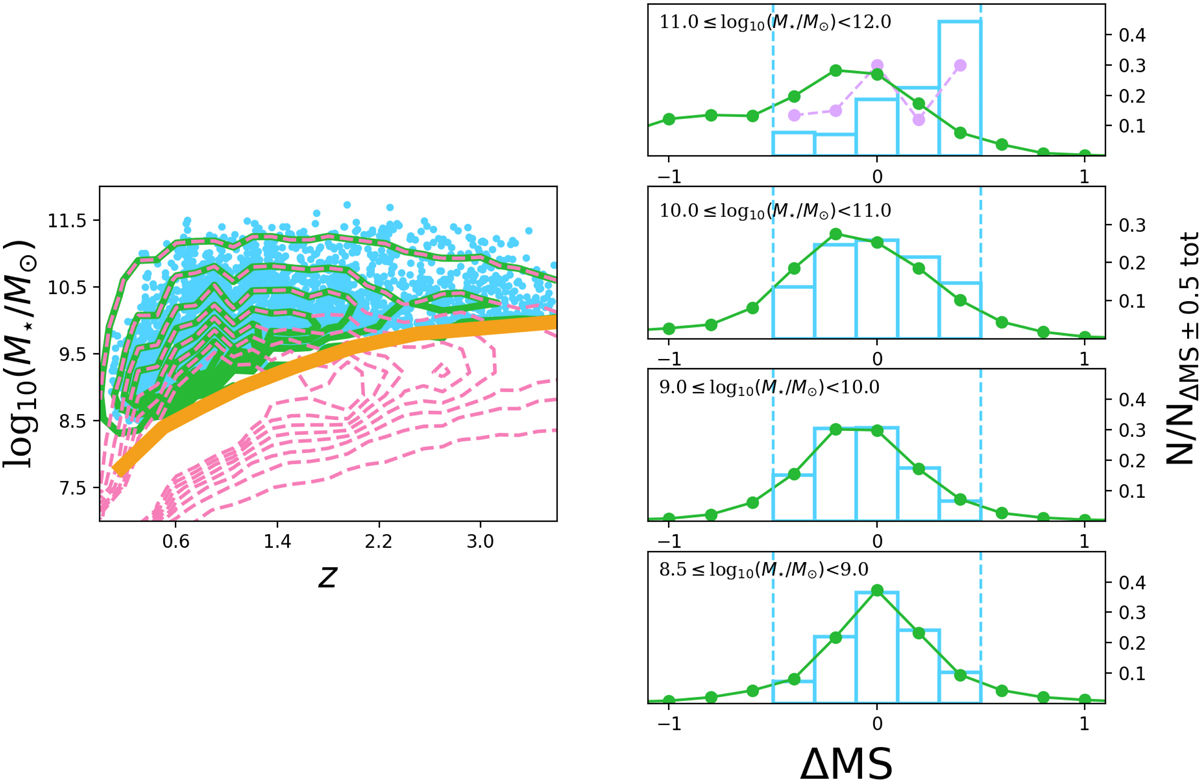
Completeness and relative ΔMS distribution in our final sample. Left: Stellar mass and redshift distribution in our final ALMA-covered mass-complete sample of MS galaxies (blue dots). The dashed pink contours display the number density of SFGs in Laigle et al. (2016), i.e., our parent sample of SFGs. The pink contour levels are in steps of 500 from 200 to 3700 galaxies per z–log10 M⋆ bin of size 0.14 and 0.15, respectively. The solid orange line represents the stellar mass completeness limit of SFGs in Laigle et al. (2016). The green contour shows the number density of SFGs in Laigle et al. (2016) above this stellar mass completeness limit, i.e., our parent mass-complete sample. The green contour levels are in steps of 500 from 200 to 3700 galaxies per z–log10 M⋆ bin of size 0.14 and 0.15, respectively. Right: Relative ΔMS distribution in our final ALMA-covered mass-complete sample of MS galaxies (blue histogram) and our mass-complete parent sample of SFGs (green histogram) in different stellar mass bins. In the highest stellar mass bin, the dashed purple line shows the relative ΔMS distribution after having rejected from our final sample all ALMA primary targets, i.e., galaxies at the phase center of the ALMA observation. The vertical dashed blue lines display the ±0.5 dex interval used to defined MS galaxies. Over this interval, the integral of each histogram is equal to one. This normalization is needed to compare our final and mass-complete parent samples, which contain 3037 and 515 465 galaxies, respectively.
Current usage metrics show cumulative count of Article Views (full-text article views including HTML views, PDF and ePub downloads, according to the available data) and Abstracts Views on Vision4Press platform.
Data correspond to usage on the plateform after 2015. The current usage metrics is available 48-96 hours after online publication and is updated daily on week days.
Initial download of the metrics may take a while.