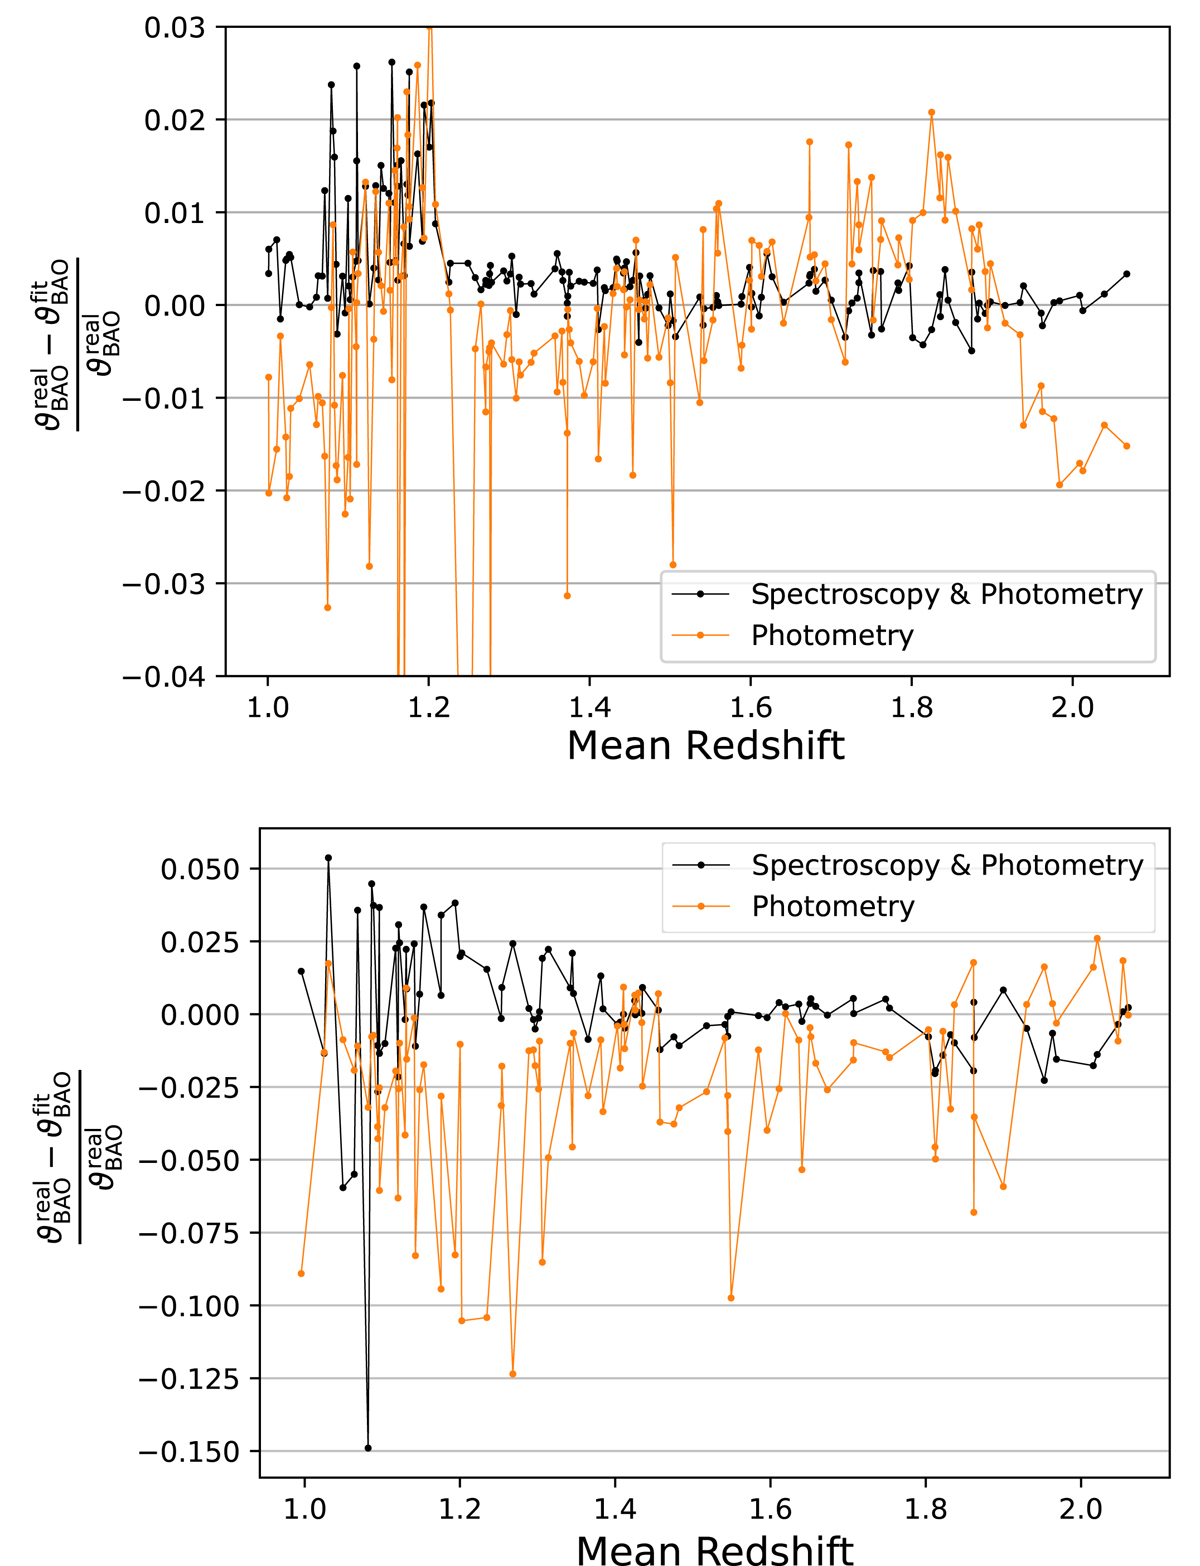
Fig. A.2.
Download original image
BAO relative errors as a function of redshift for the samples shown in Fig. A.1. The results from the combination of stacked spectroscopy and photometry and stacked photometry are respectively plotted in black and orange. The BAO position could not be fitted in the spectroscopy-only analysis so the error in this case is not shown.
Current usage metrics show cumulative count of Article Views (full-text article views including HTML views, PDF and ePub downloads, according to the available data) and Abstracts Views on Vision4Press platform.
Data correspond to usage on the plateform after 2015. The current usage metrics is available 48-96 hours after online publication and is updated daily on week days.
Initial download of the metrics may take a while.