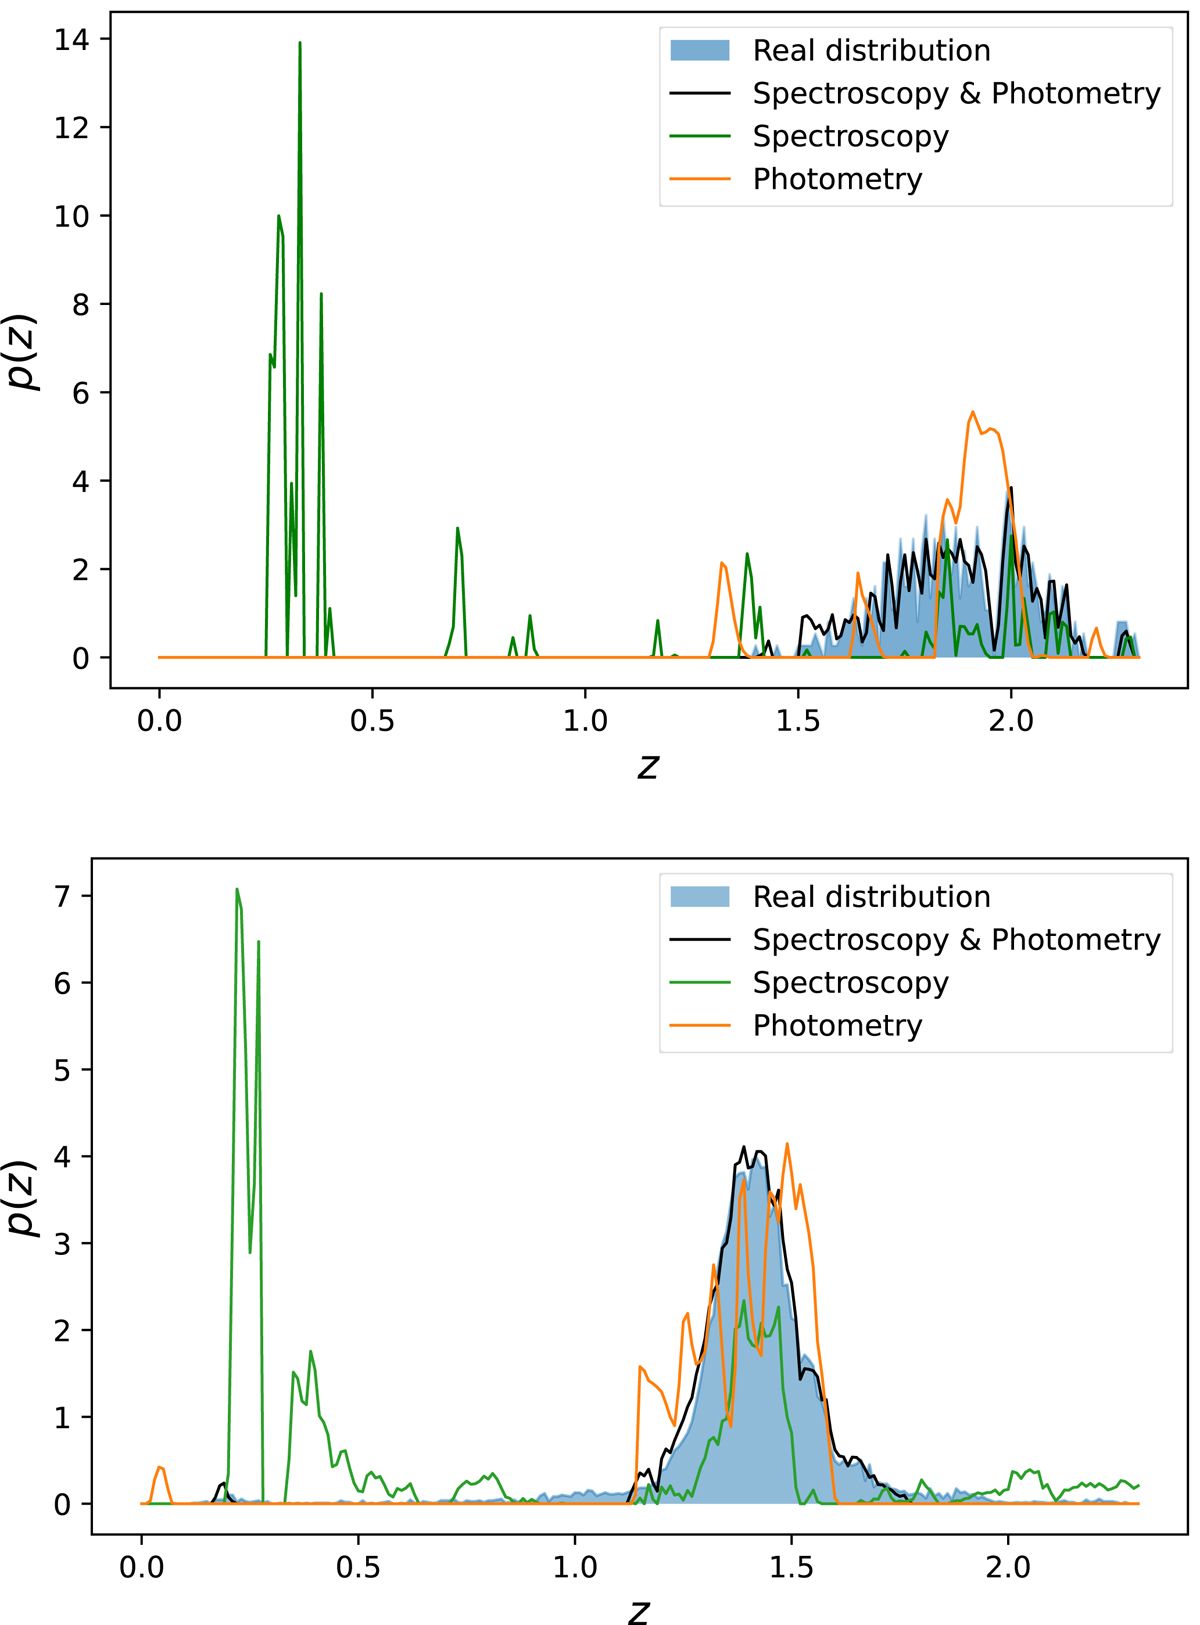
Fig. A.1.
Download original image
Two example redshift distributions from the analyses of the non-attenuated catalogue, top panel, and the real attenuation one, bottom panel, without the measurement noise and obtained with the ElasticNet regularisation. The results from the combination of stacked spectroscopy and photometry, stacked spectroscopy alone and stacked photometry are respectively plotted in black, green and orange. The real distribution is the filled blue histogram.
Current usage metrics show cumulative count of Article Views (full-text article views including HTML views, PDF and ePub downloads, according to the available data) and Abstracts Views on Vision4Press platform.
Data correspond to usage on the plateform after 2015. The current usage metrics is available 48-96 hours after online publication and is updated daily on week days.
Initial download of the metrics may take a while.