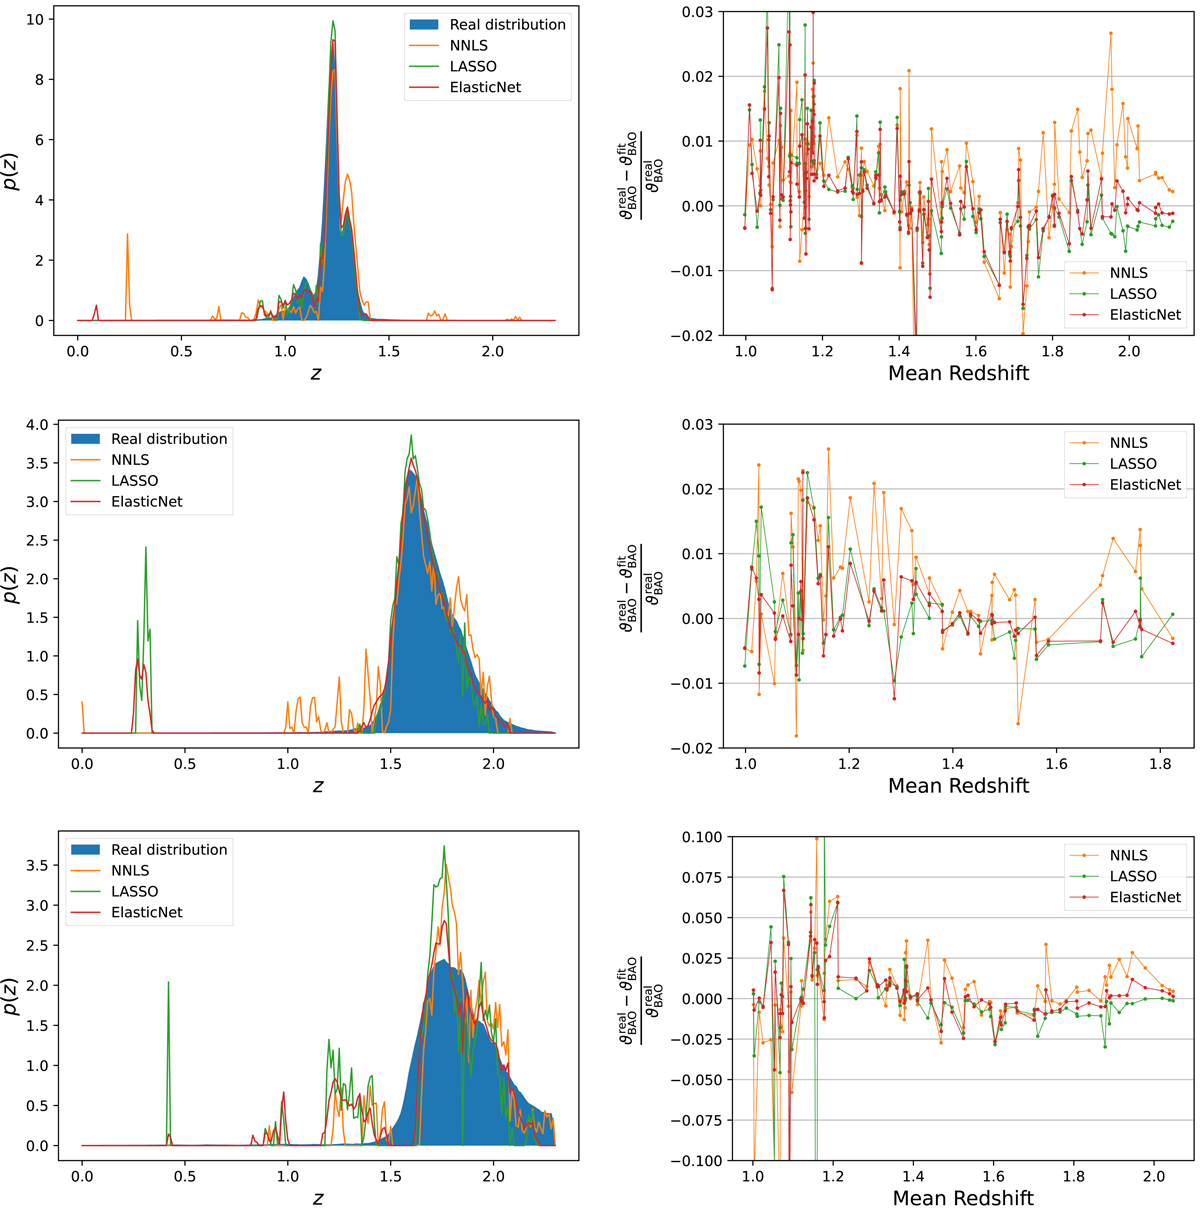
Fig. 6.
Download original image
Results on ideal spectroscopy without measurement noise. Top row: results of the non-attenuated catalogue analyses. Middle row: results of the fixed attenuation catalogue analyses. Bottom row: results of the real attenuation catalogue analyses. NNLS, LASSO and ElasticNet results are respectively plotted in orange, green and red. The left column shows examples of redshift distribution fits with the real distribution plotted in blue. Shown on the right is the BAO relative error of the analysed colour groups ordered by redshift.
Current usage metrics show cumulative count of Article Views (full-text article views including HTML views, PDF and ePub downloads, according to the available data) and Abstracts Views on Vision4Press platform.
Data correspond to usage on the plateform after 2015. The current usage metrics is available 48-96 hours after online publication and is updated daily on week days.
Initial download of the metrics may take a while.