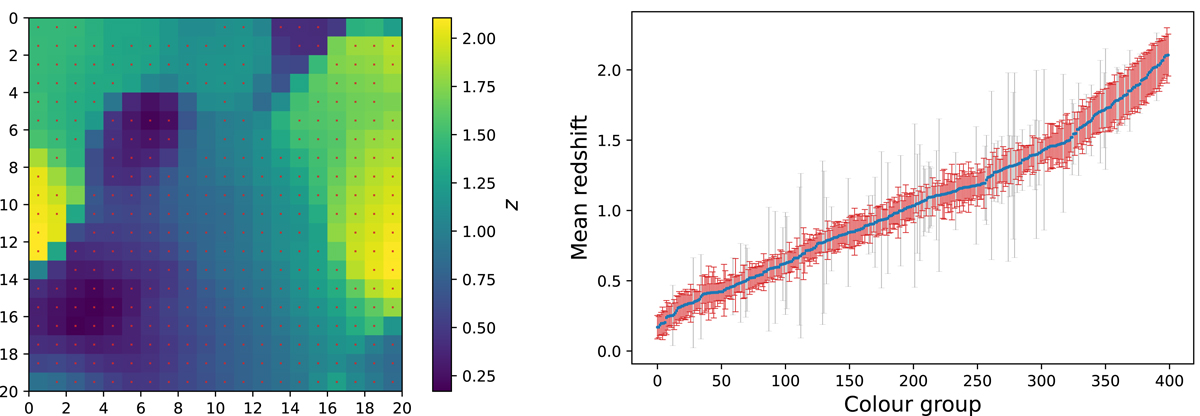
Fig. 4.
Download original image
Photometric redshift division with SOM. Left: the two-dimensional projection of the galaxy colour groups constructed with the SOM. The colour scale indicates the mean redshift of the SOM cells, which we define as colour groups. The red spots identify the cells with σz < 0.20. Right: the colour groups sorted by their mean redshift. The error bar represents the standard deviation of redshift, σz, in each group. The groups with red error bars are the one with σz < 0.20.
Current usage metrics show cumulative count of Article Views (full-text article views including HTML views, PDF and ePub downloads, according to the available data) and Abstracts Views on Vision4Press platform.
Data correspond to usage on the plateform after 2015. The current usage metrics is available 48-96 hours after online publication and is updated daily on week days.
Initial download of the metrics may take a while.