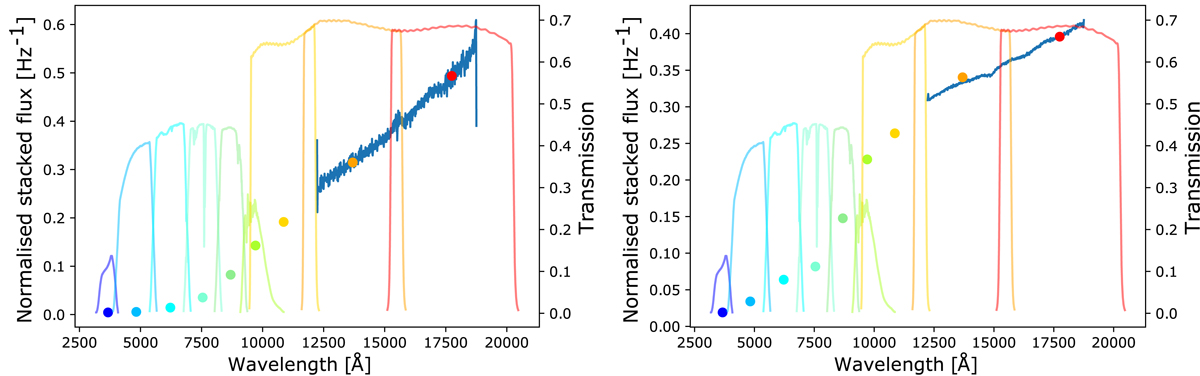
Fig. 2.
Download original image
Stacked spectro-photometry for two groups of galaxies that have been photometrically selected (see Sect. 3.3). The photometric data includes EuclidYJH and the Vera C. Rubin Observatory ugrizy bands and the spectrocscopic data is from the Euclid NISP instrument with simulated noise. The photometric bandpasses used in the analysis are over-plotted. In both plots the photometric uncertainty bars are smaller than the markers. Left: an example stack for a group of galaxies with mean redshift z = 1.10. The stack includes 2 × 10³ galaxies. Right: stacked flux for a group at mean redshift z = 1.44 with 2 × 10⁶ galaxies.
Current usage metrics show cumulative count of Article Views (full-text article views including HTML views, PDF and ePub downloads, according to the available data) and Abstracts Views on Vision4Press platform.
Data correspond to usage on the plateform after 2015. The current usage metrics is available 48-96 hours after online publication and is updated daily on week days.
Initial download of the metrics may take a while.