Fig. B.2.
Download original image
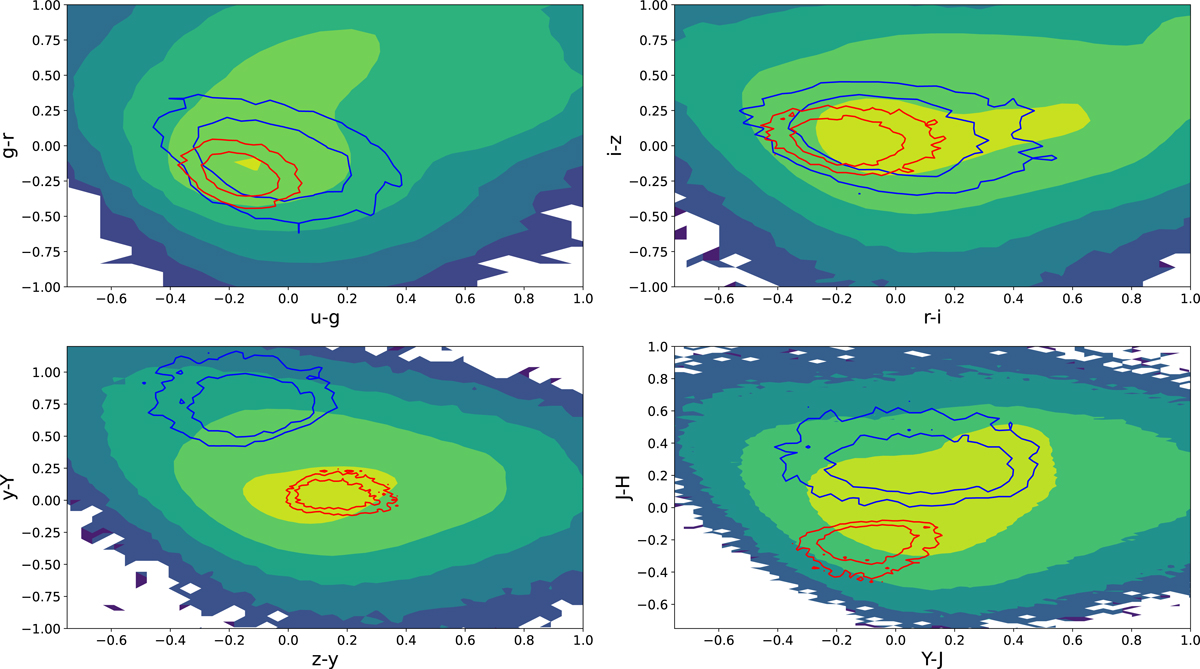
Contour plots of the colour distributions. The filled lines show the distribution of all galaxies in the catalogue, while the red and blue ones represent the colour distributions of two cells of the SOM. The inner and outer contour lines contain 90% and 68% of the samples. The figure shows how the SOM groups galaxies with similar colours in the same cells and how different cells have different colour distributions.
Current usage metrics show cumulative count of Article Views (full-text article views including HTML views, PDF and ePub downloads, according to the available data) and Abstracts Views on Vision4Press platform.
Data correspond to usage on the plateform after 2015. The current usage metrics is available 48-96 hours after online publication and is updated daily on week days.
Initial download of the metrics may take a while.