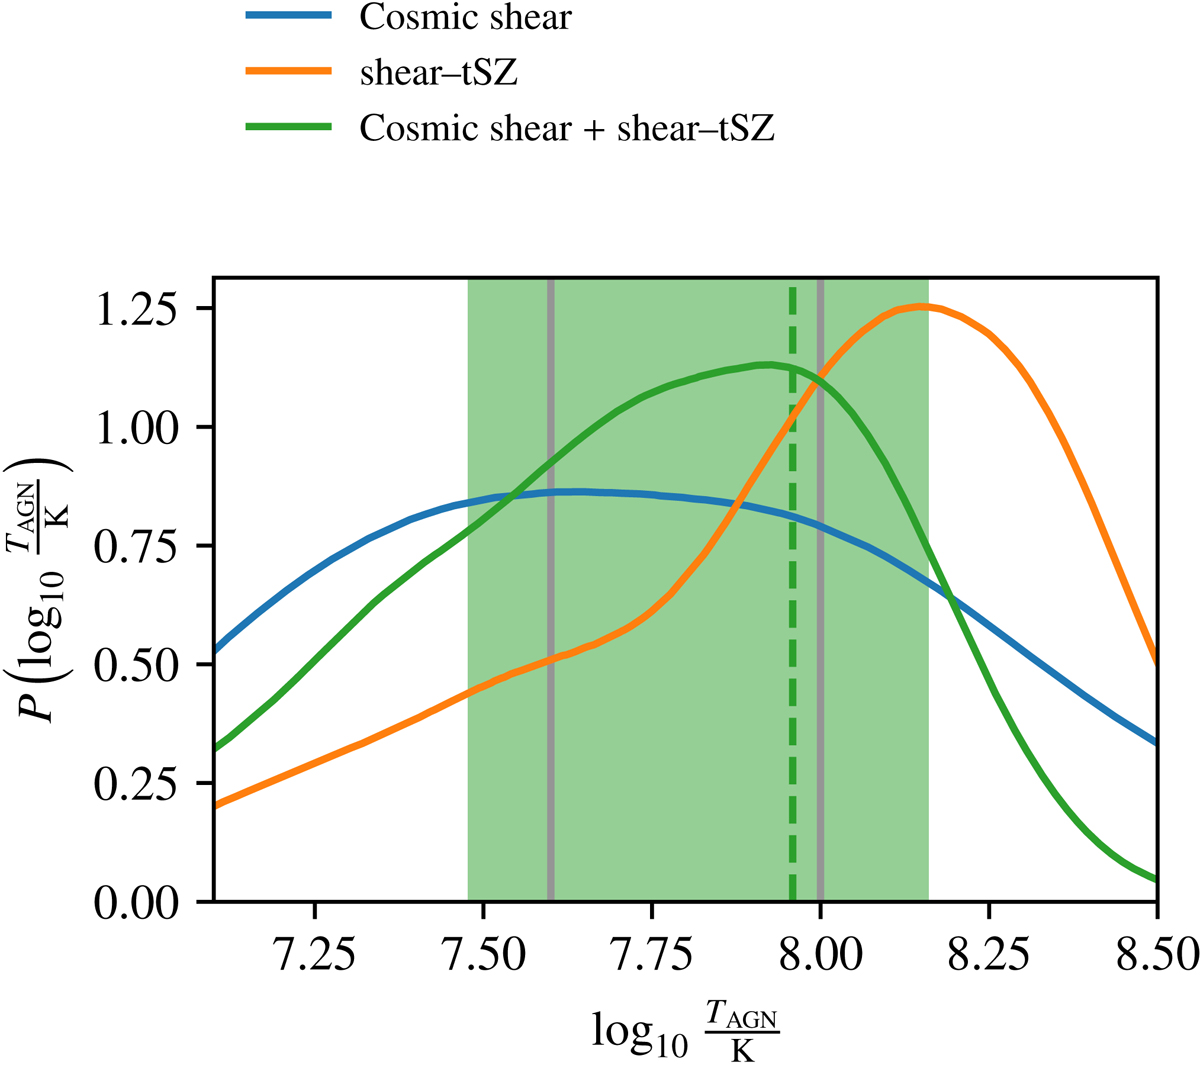
Fig. 9.
Download original image
Marginal posterior densities of the baryon feedback strength, parameterised by log10(TAGN/K). The green band and dashed line indicate the 68th percentile marginal CI and MAP, respectively, of the joint analysis of cosmic shear and the shear–tSZ cross-correlation. The grey lines indicate the range of the feedback strength implemented in the BAHAMAS suite of hydrodynamical simulations, which our HMX model is calibrated on.
Current usage metrics show cumulative count of Article Views (full-text article views including HTML views, PDF and ePub downloads, according to the available data) and Abstracts Views on Vision4Press platform.
Data correspond to usage on the plateform after 2015. The current usage metrics is available 48-96 hours after online publication and is updated daily on week days.
Initial download of the metrics may take a while.