Free Access
Fig. 8.
Download original image
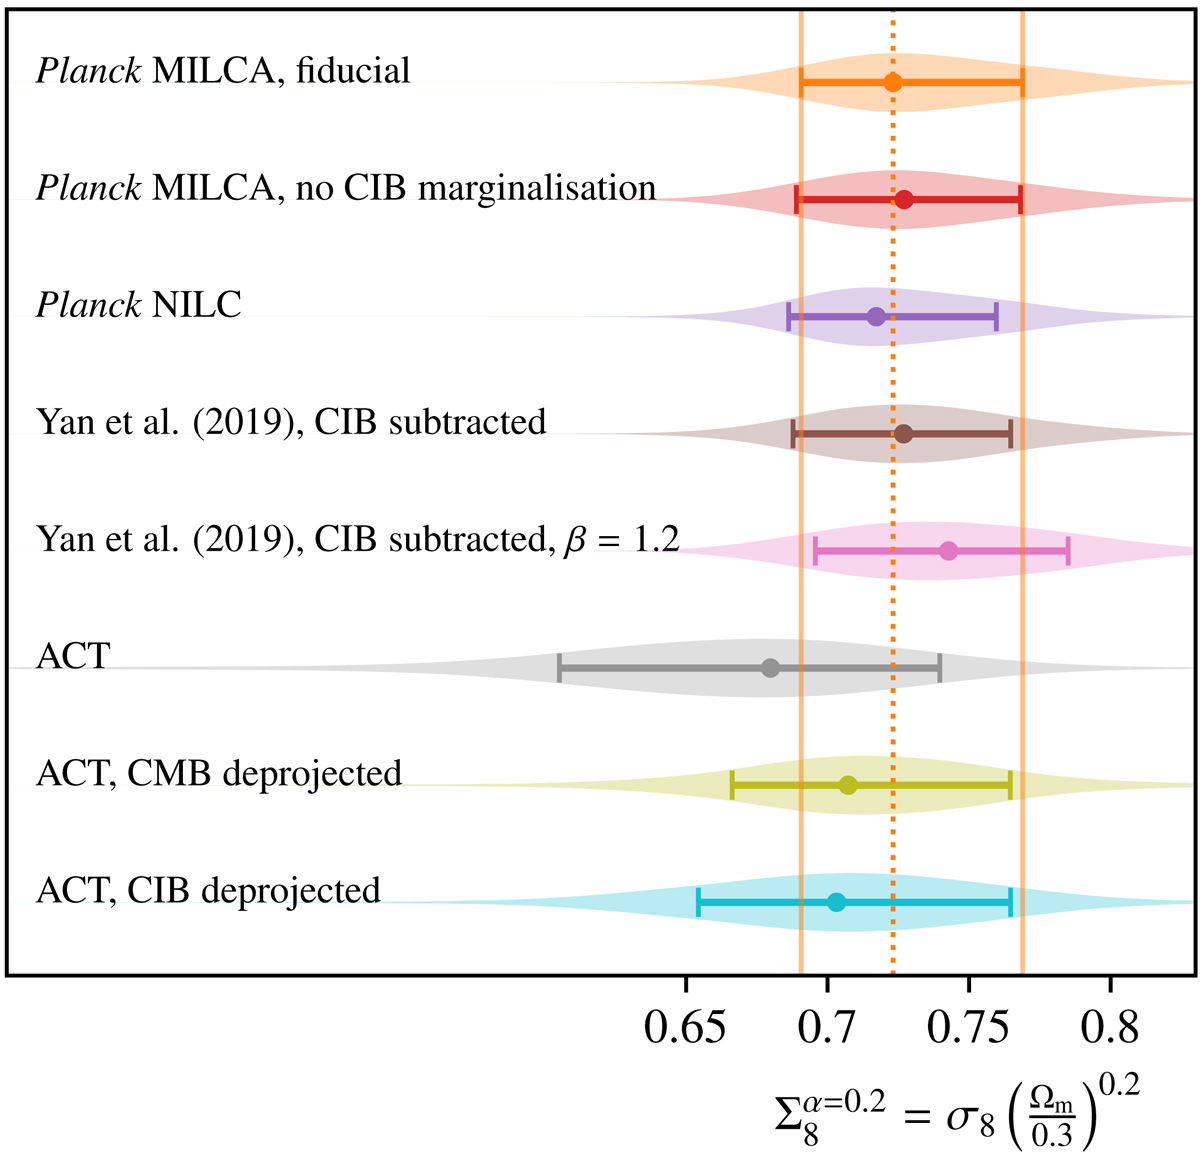
Marginal posterior densities of ![]() from the cross-correlation of KiDS and different Compton-y maps. The orange band and dashed line indicate the marginal 68th percentile CI and mode of the marginal posterior of the fiducial setup.
from the cross-correlation of KiDS and different Compton-y maps. The orange band and dashed line indicate the marginal 68th percentile CI and mode of the marginal posterior of the fiducial setup.
Current usage metrics show cumulative count of Article Views (full-text article views including HTML views, PDF and ePub downloads, according to the available data) and Abstracts Views on Vision4Press platform.
Data correspond to usage on the plateform after 2015. The current usage metrics is available 48-96 hours after online publication and is updated daily on week days.
Initial download of the metrics may take a while.