Fig. 5.
Download original image
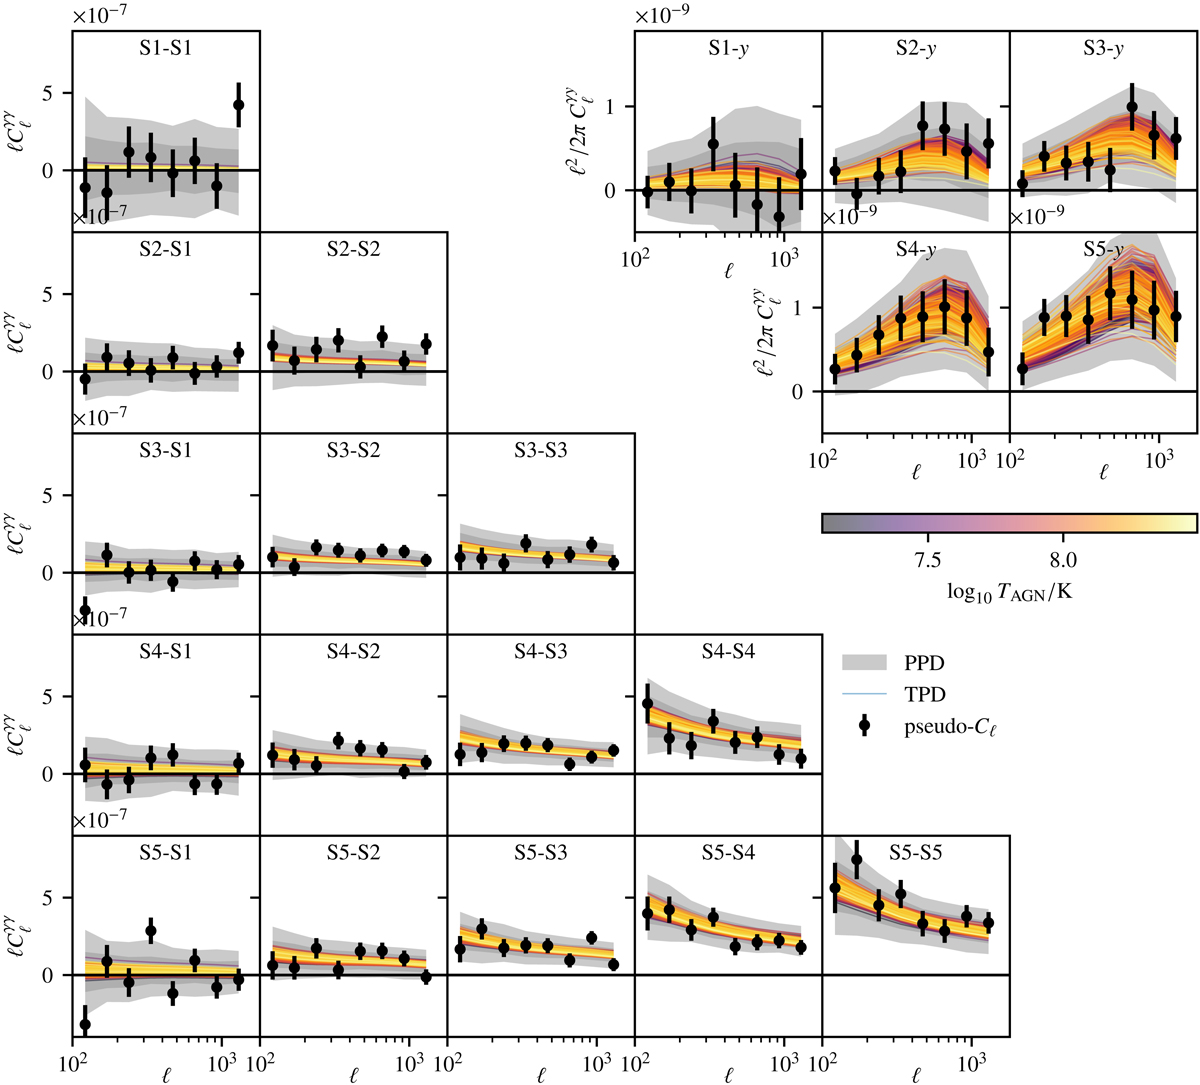
Measured angular power spectra of KiDS-1000 cosmic shear (bottom left) and the angular cross-power spectra between KiDS-1000 shear and the tSZ effect (top right). Shown here is the cross-correlation using the MILCAPlanck Compton-y map. The grey bands indicate the 68th and 95th percentile of the posterior predictive distribution (PPD) of the joint-analysis posterior. Coloured lines are samples of the translated posterior distribution (TPD), with the colour corresponding to the baryon feedback strength. Since the TPD is derived from the full joint-posterior, the baryon feedback strength only accounts for part of the variance of the shown TPD samples.
Current usage metrics show cumulative count of Article Views (full-text article views including HTML views, PDF and ePub downloads, according to the available data) and Abstracts Views on Vision4Press platform.
Data correspond to usage on the plateform after 2015. The current usage metrics is available 48-96 hours after online publication and is updated daily on week days.
Initial download of the metrics may take a while.