Free Access
Fig. 3.
Download original image
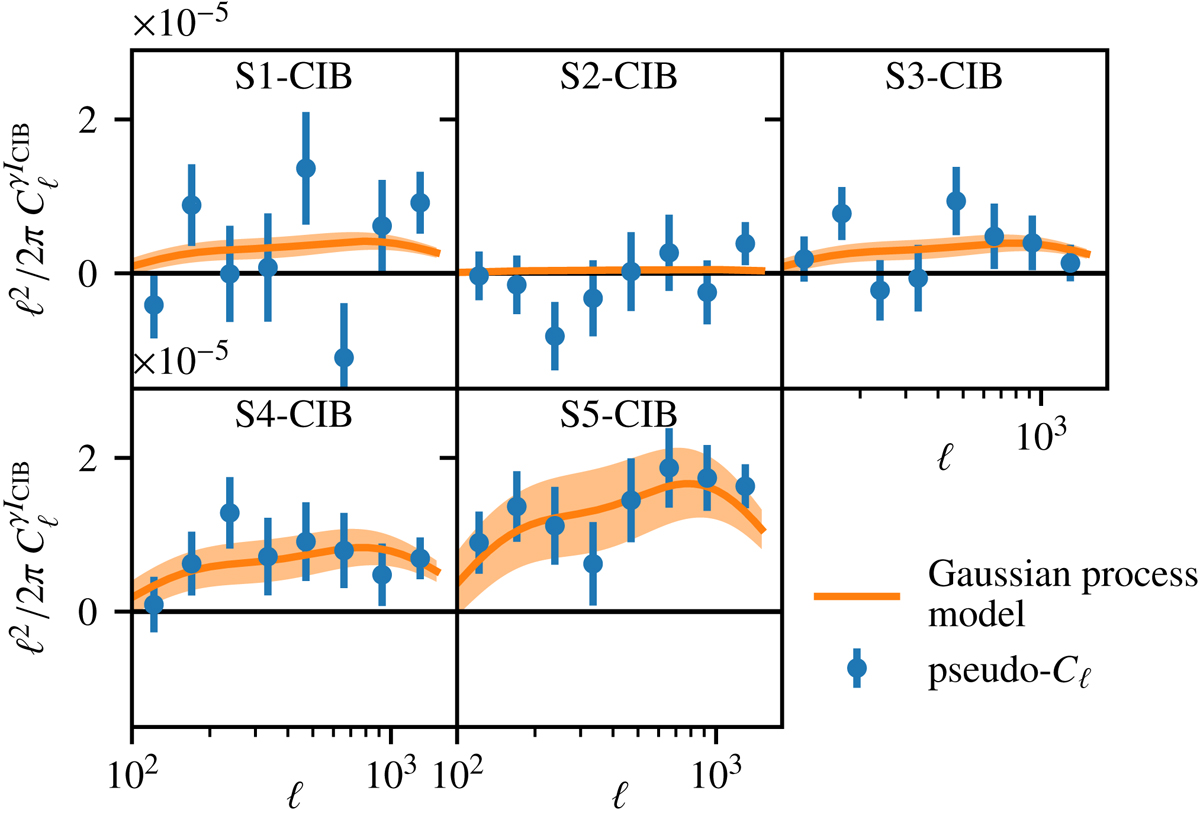
Measured angular cross-power spectra between KiDS-1000 shear and the 545 GHz CIB map (blue points). The best-fit Gaussian process (GP) model is shown as the orange line, with the orange shaded band indicating the 68th percentiles of the GP model uncertainty.
Current usage metrics show cumulative count of Article Views (full-text article views including HTML views, PDF and ePub downloads, according to the available data) and Abstracts Views on Vision4Press platform.
Data correspond to usage on the plateform after 2015. The current usage metrics is available 48-96 hours after online publication and is updated daily on week days.
Initial download of the metrics may take a while.