Fig. B.2.
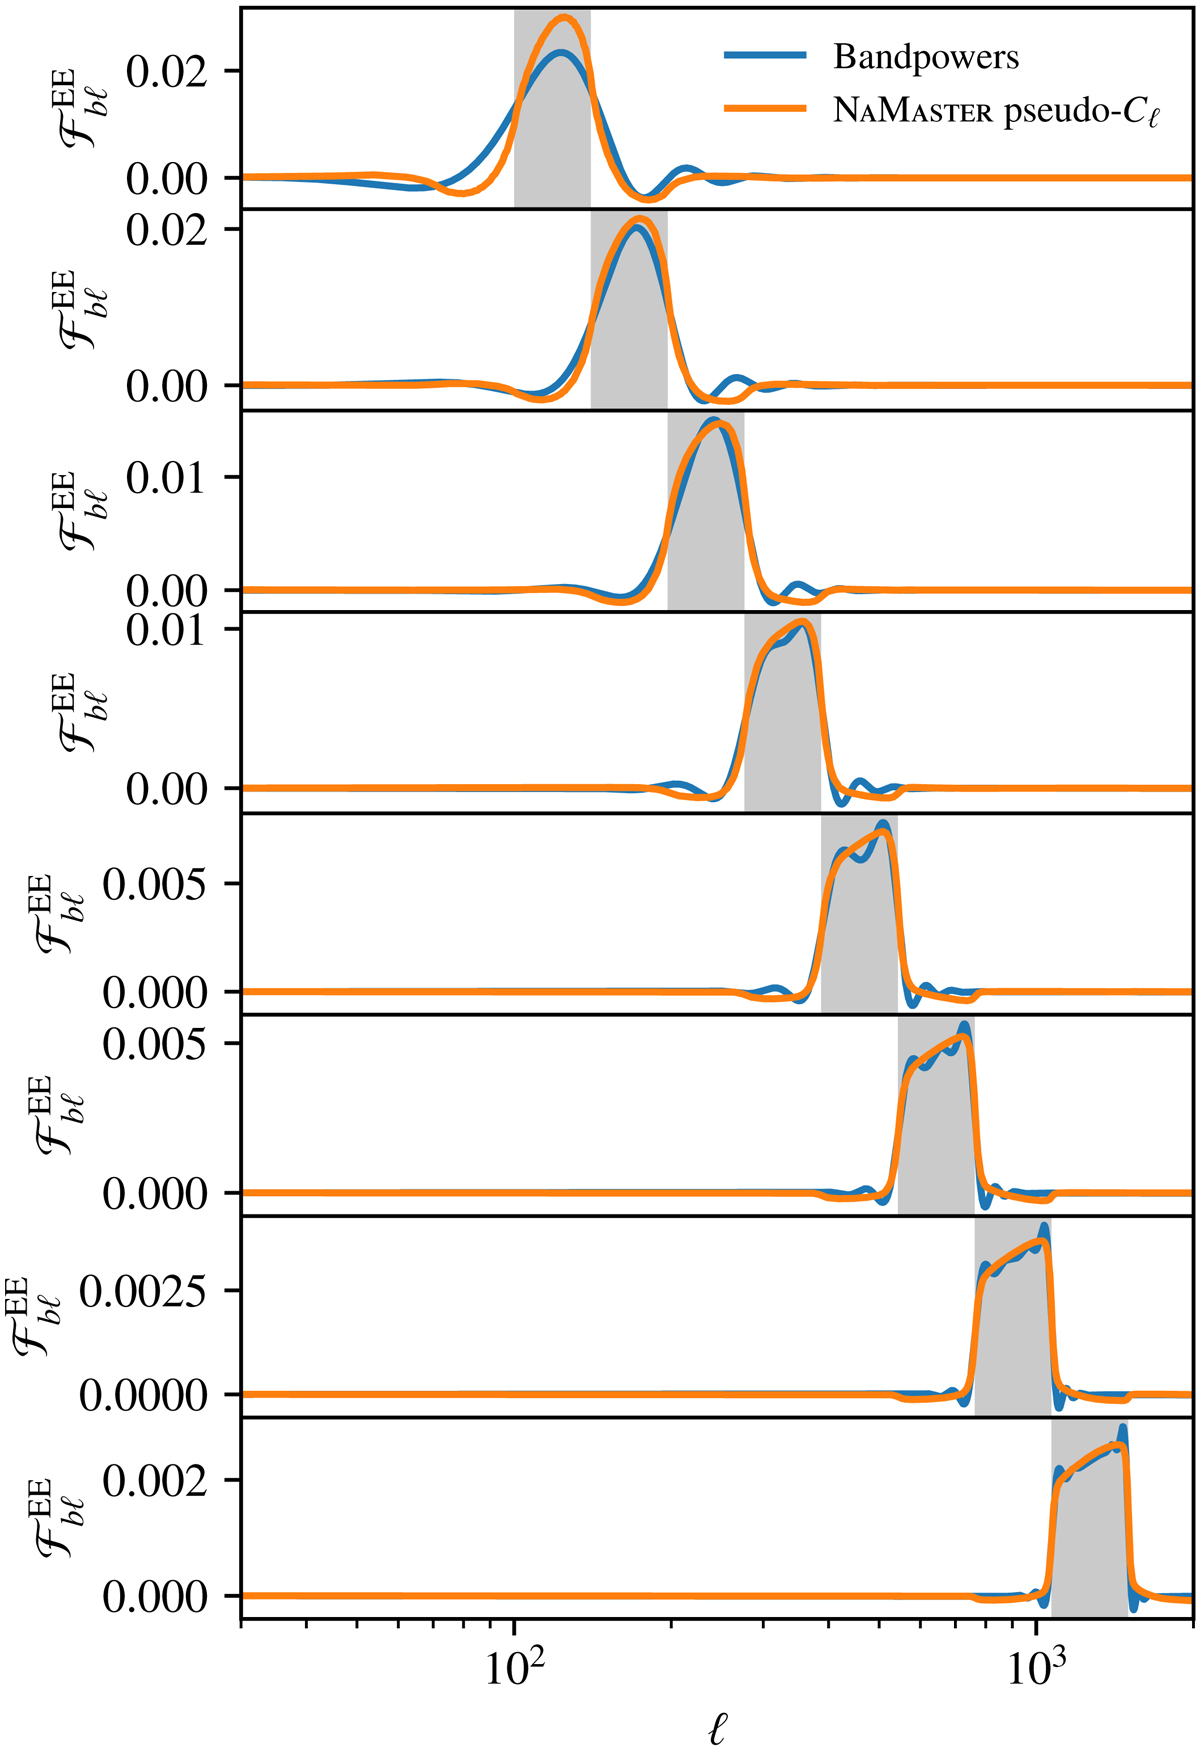
Download original image
Window functions of Eq. (7), relating the smooth angular power spectrum model to the binned prediction compatible with the measured data vector. The differences between the multipole bin (grey bands) and the window function are due to masking and weighting of the shear maps in the case of the pseudo-Cℓ estimator (orange) and the finite angular range used for the band-power estimator (blue).
Current usage metrics show cumulative count of Article Views (full-text article views including HTML views, PDF and ePub downloads, according to the available data) and Abstracts Views on Vision4Press platform.
Data correspond to usage on the plateform after 2015. The current usage metrics is available 48-96 hours after online publication and is updated daily on week days.
Initial download of the metrics may take a while.