Fig. 1.
Download original image
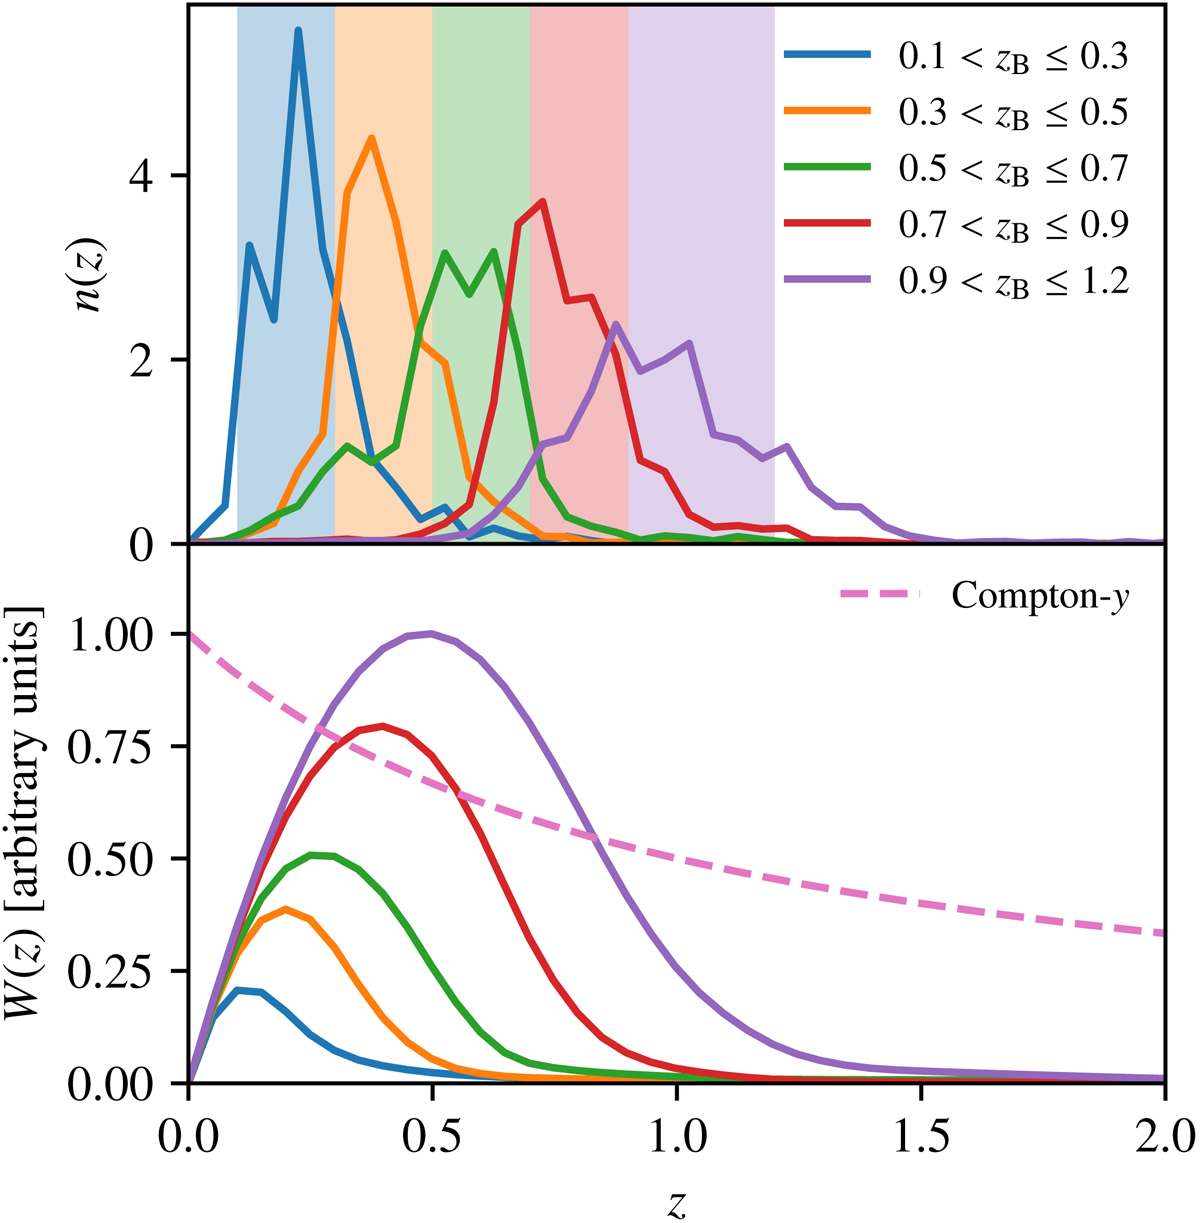
Top: redshift distributions ni(z) of the five tomographic source samples (solid lines). The shaded bands indicate the selection window on the photometric redshift point estimate zB. Bottom: line-of-sight window function, W(z), to project the three-dimensional power spectra P(k) (in comoving units) into their angular counterparts, Cℓ. The lensing window functions (solid lines, Eq. (5)) are normalised by the maximum of the window function of the last tomographic bin, while the Compton-y window function (dashed line, Eq. (6)) is normalised by its maximum value.
Current usage metrics show cumulative count of Article Views (full-text article views including HTML views, PDF and ePub downloads, according to the available data) and Abstracts Views on Vision4Press platform.
Data correspond to usage on the plateform after 2015. The current usage metrics is available 48-96 hours after online publication and is updated daily on week days.
Initial download of the metrics may take a while.