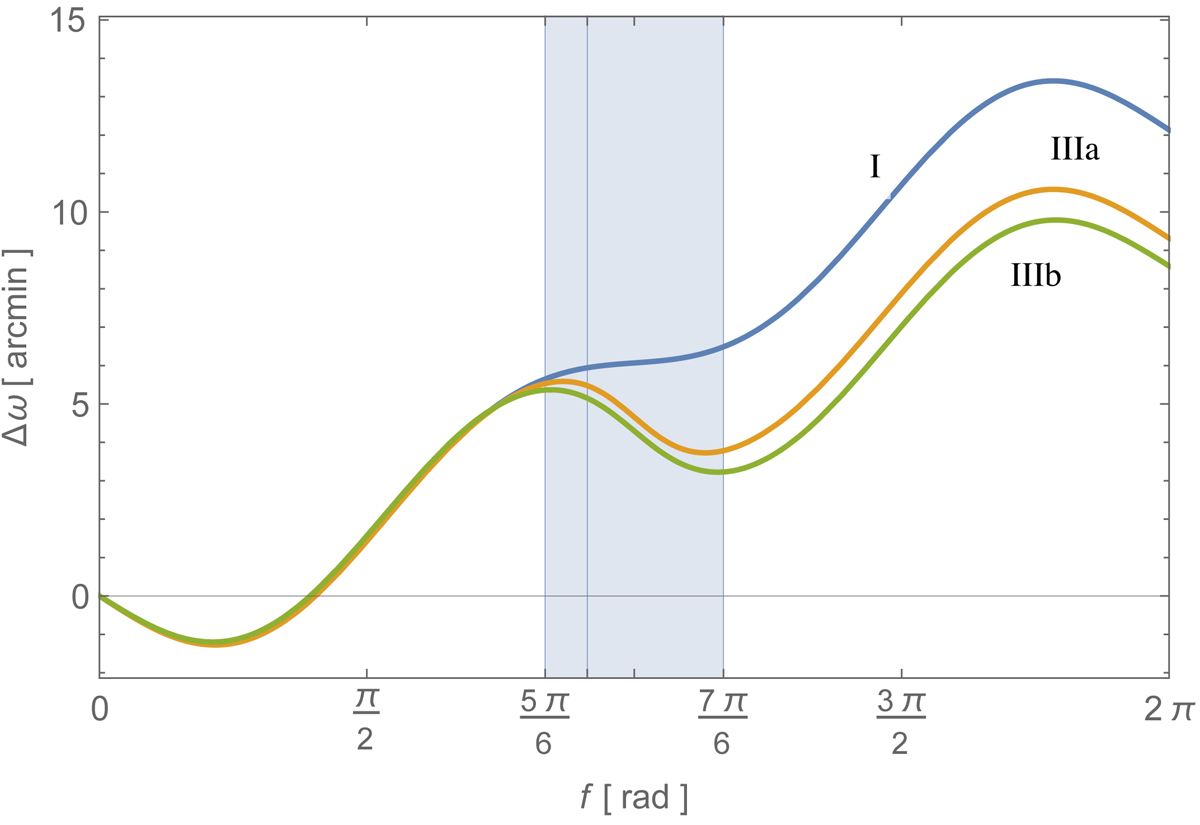
Fig. 4.
Download original image
Δω(f) = ω(f)−ω0 for models (I), (IIIa), and (IIIb). The discrepancy in pericentre shift per orbit between models (IIIa)–(IIIb) with extended mass and model (I) without it predominantly builds up in the shaded blue region. The vertical line within this region marks the true anomaly of model (I) in 2021.96, which is approximately the time of publication (GRAVITY Collaboration 2022).
Current usage metrics show cumulative count of Article Views (full-text article views including HTML views, PDF and ePub downloads, according to the available data) and Abstracts Views on Vision4Press platform.
Data correspond to usage on the plateform after 2015. The current usage metrics is available 48-96 hours after online publication and is updated daily on week days.
Initial download of the metrics may take a while.