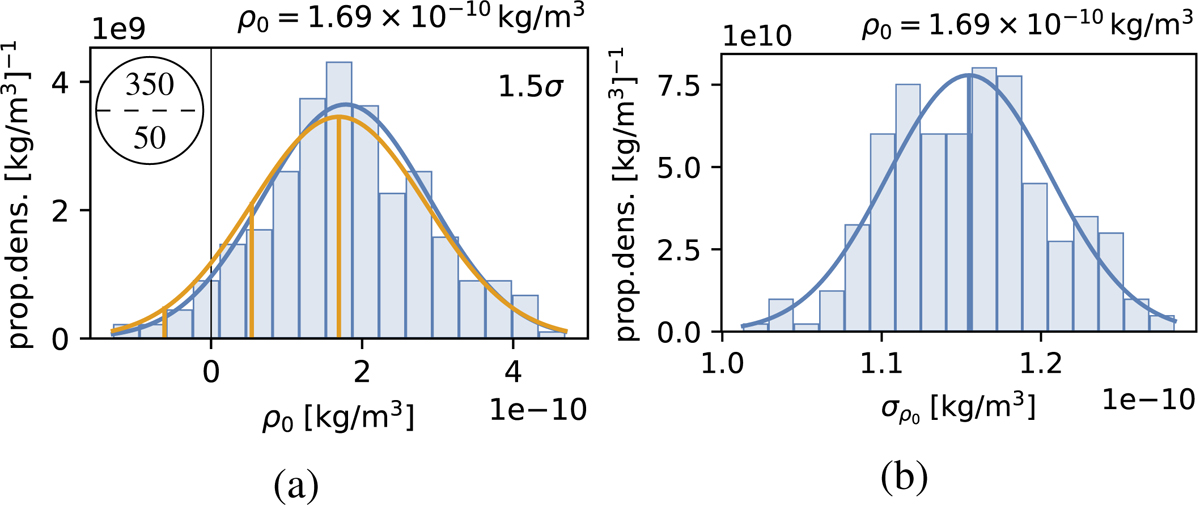
Fig. 10.
Download original image
Density parameter statistics of the fits to 250 mock datasets of the case of Fig. 9a with histograms of the best-fit parameters (a) and of the corresponding error estimates (b). The blue normal distributions have means and variances according to the data of the histograms. The orange normal distribution in (c) has a mean of Eq. (15) (i.e. the value the mock data are based on) and a variance equal to the mean of the distribution in (b). The latter distribution has marks for 1 and 2 one-sided standard deviations. The number of sigmas with which zero is rejected is shown in the top right.
Current usage metrics show cumulative count of Article Views (full-text article views including HTML views, PDF and ePub downloads, according to the available data) and Abstracts Views on Vision4Press platform.
Data correspond to usage on the plateform after 2015. The current usage metrics is available 48-96 hours after online publication and is updated daily on week days.
Initial download of the metrics may take a while.