Fig. B.1
Download original image
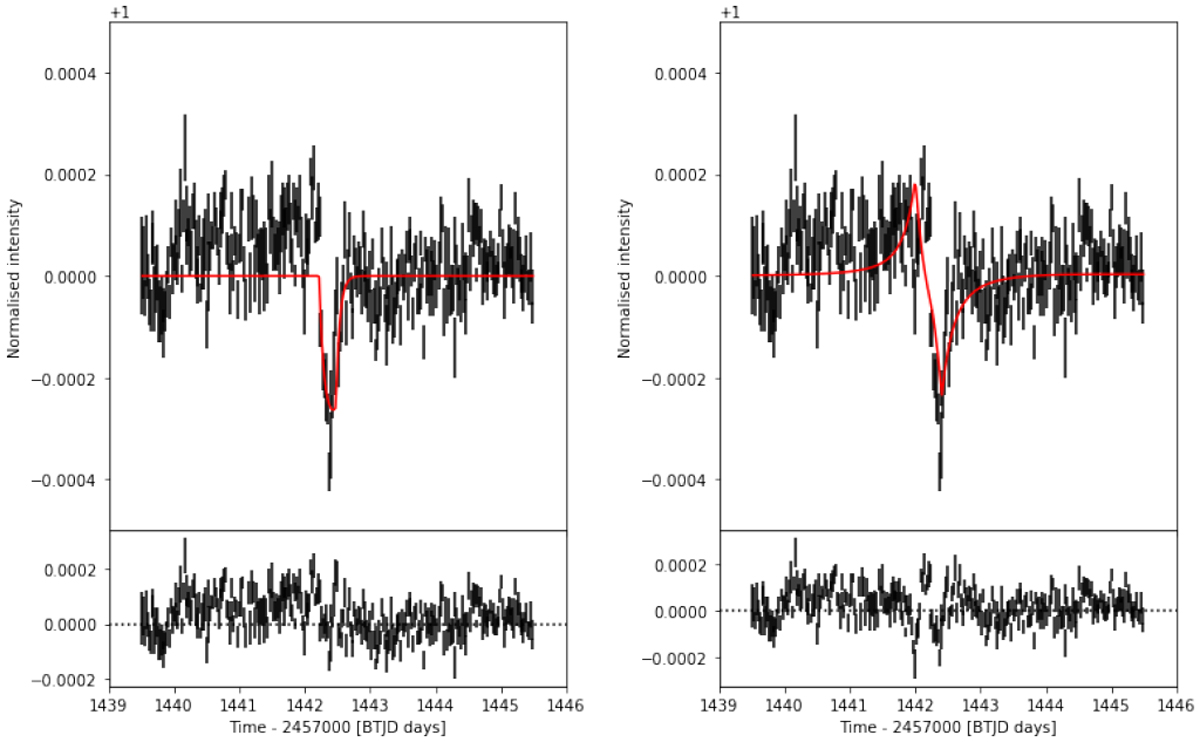
Light curve of ß Pic limited to approximately ± 3 days around the transit event 1 in sector 5. The observed and modeled flux are marked with black and red lines, respectively. The upper left panel presents the modeled transit profile in case scattering is not accounted for; the upper right panel shows the modeled transit profile in case the scattering function is included into the model. The bottom panels show residuals between the observed and modeled flux.
Current usage metrics show cumulative count of Article Views (full-text article views including HTML views, PDF and ePub downloads, according to the available data) and Abstracts Views on Vision4Press platform.
Data correspond to usage on the plateform after 2015. The current usage metrics is available 48-96 hours after online publication and is updated daily on week days.
Initial download of the metrics may take a while.