Fig. 5
Download original image
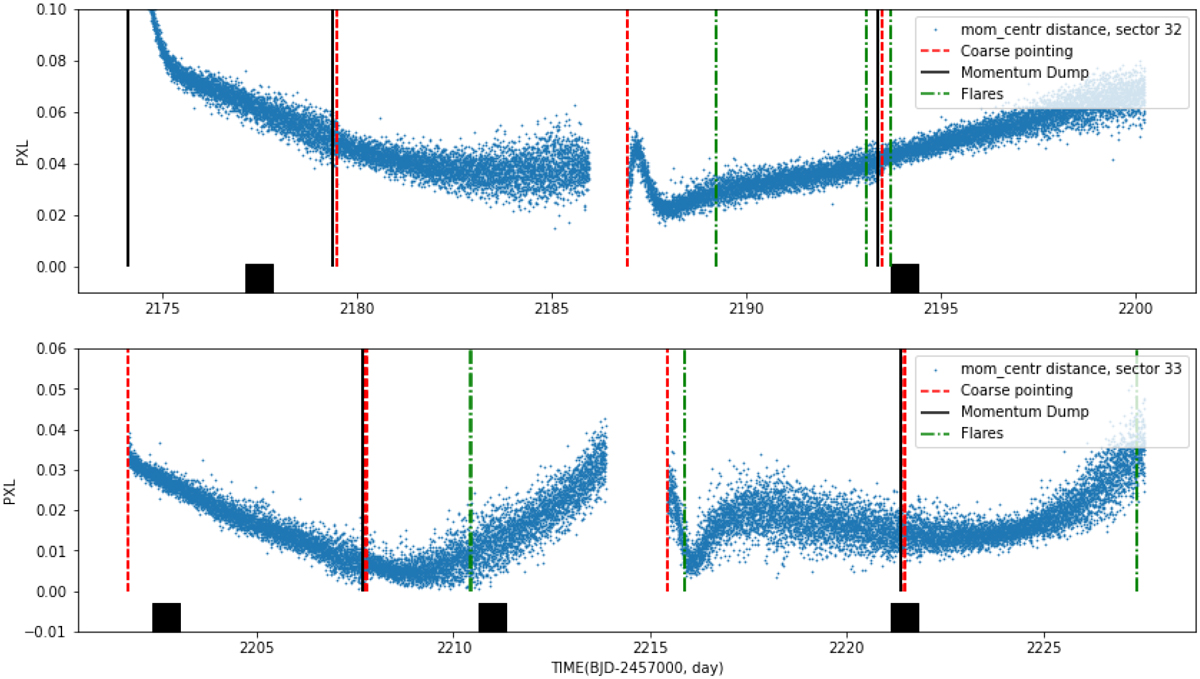
Instantaneous positions of the target’s flux-weighted centroids for sectors 32 and 33. The black rectangles mark the transit events identified. The red vertical dashed lines and black solid lines mark the intervals of the spacecraft’s coarse pointing and the momentum dump events, respectively. The green dotted-dashed lines mark flares.
Current usage metrics show cumulative count of Article Views (full-text article views including HTML views, PDF and ePub downloads, according to the available data) and Abstracts Views on Vision4Press platform.
Data correspond to usage on the plateform after 2015. The current usage metrics is available 48-96 hours after online publication and is updated daily on week days.
Initial download of the metrics may take a while.