Free Access
Fig. 2
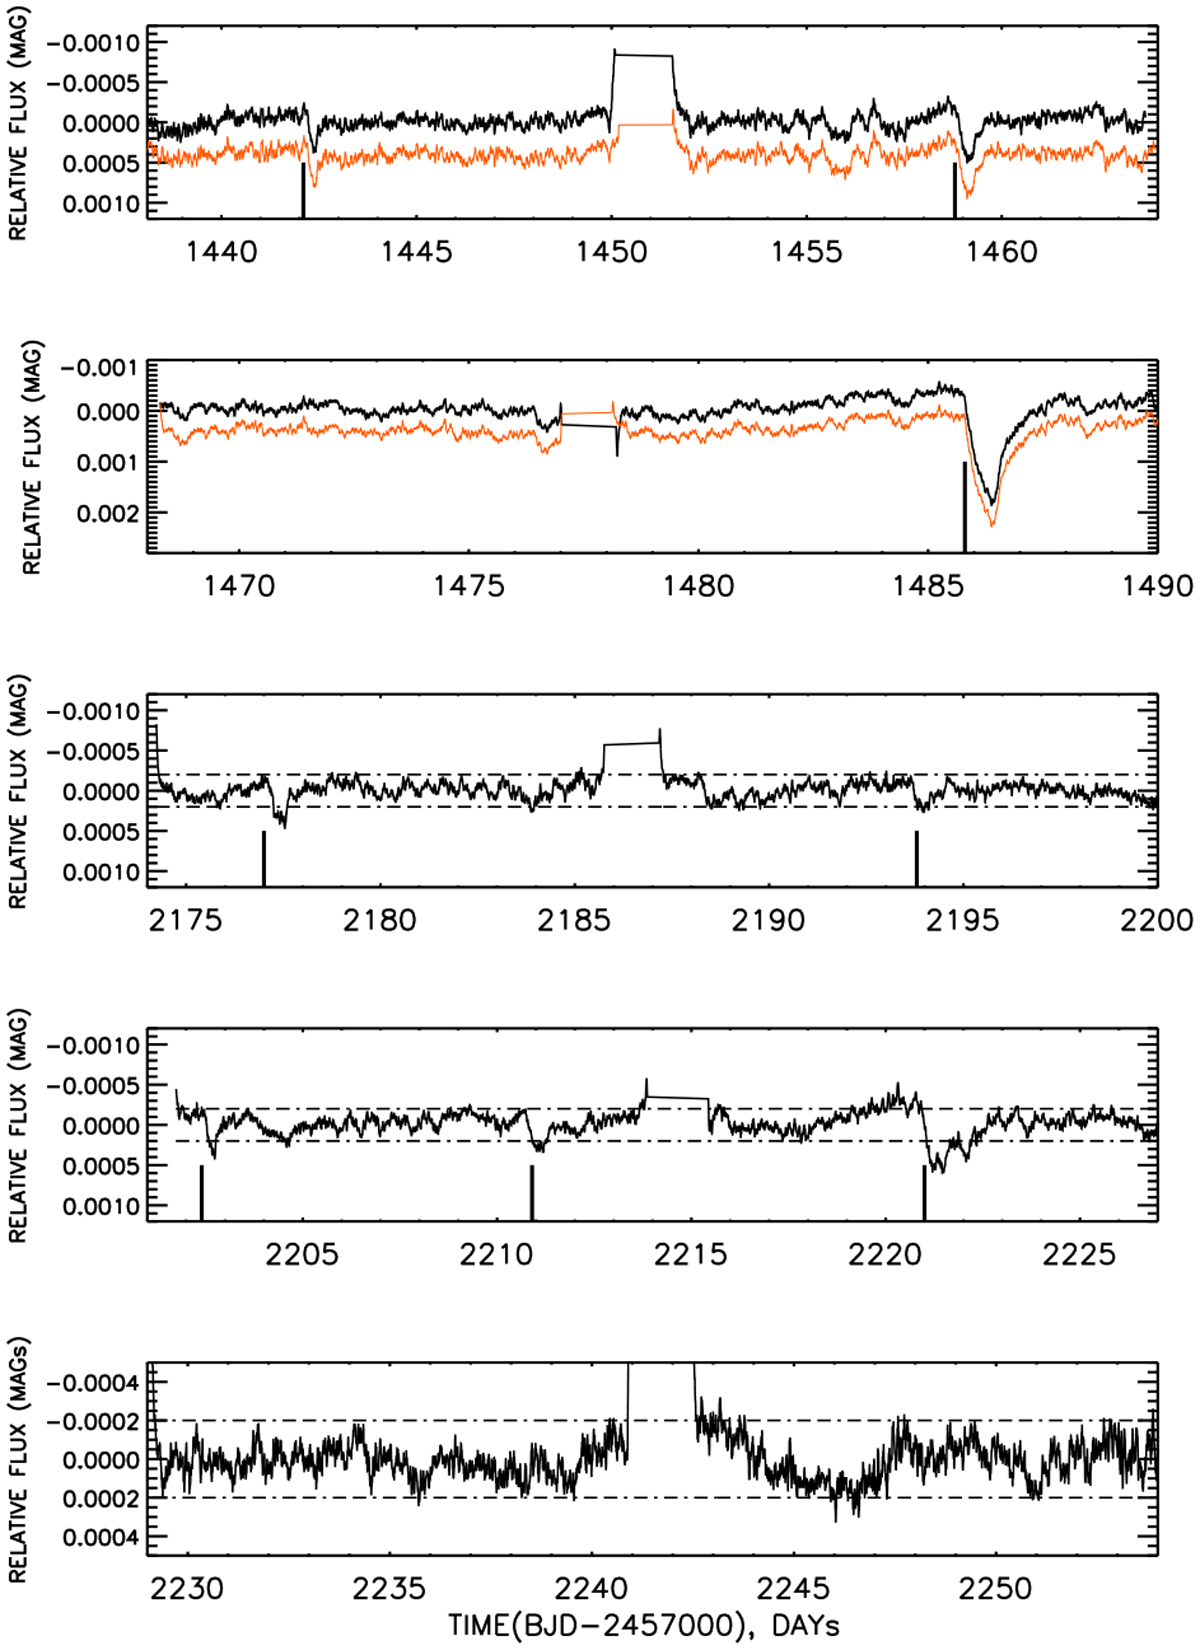
Download original image
Differences between the model and observed light curves of ß Pic for sectors 5, 6, 32, 33, and 34 (from top to the bottom, respectively). The black and orange curves in the two top panels display the light curve residuals obtained in this work and by Zieba et al. (2019), respectively. A small offset was applied for clarity.
Current usage metrics show cumulative count of Article Views (full-text article views including HTML views, PDF and ePub downloads, according to the available data) and Abstracts Views on Vision4Press platform.
Data correspond to usage on the plateform after 2015. The current usage metrics is available 48-96 hours after online publication and is updated daily on week days.
Initial download of the metrics may take a while.