Fig. 2.

Download original image
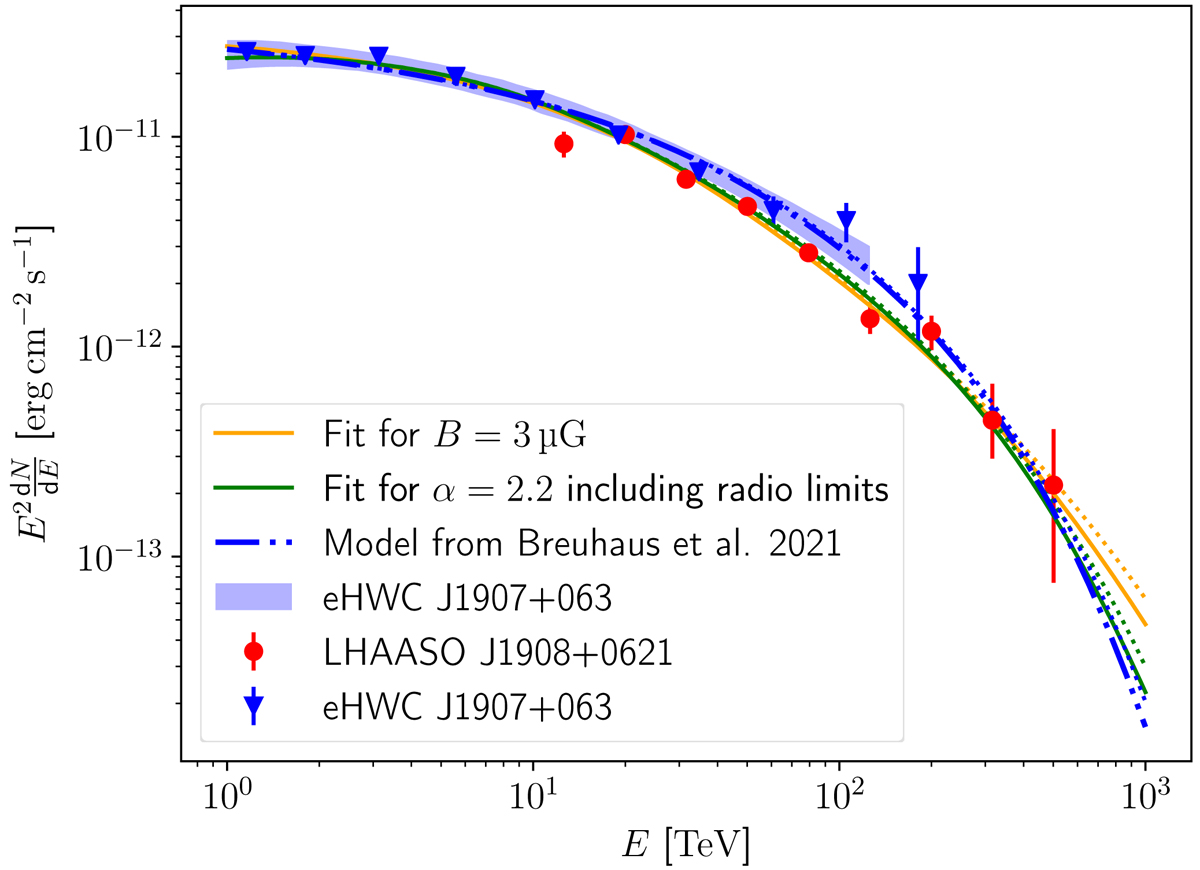
Model fit for LHAASO J1908+0621 and eHWC J1907+063 together with the corresponding data and the model from B21 for eHWC J1907+063. Red data points show the data from the LHAASO collaboration (Cao et al. 2021a) and the blue triangles data from the HAWC collaboration for eHWC J1907+063 (Abeysekara et al. 2020). The blue band shows the systematic and statistical error for eHWC J1907+063 (Abeysekara et al. 2020) and the dashed-dotted blue line the corresponding model from B21 extended to higher energies and corrected for absorption. The orange curve represents the joint fit to the data from HAWC and LHAASO for B = 3 μG, resulting in Ṅ0 = 1 × 1036 erg−1 s−1 and α = 2.66, assuming an association with PSR 1907+0602. Ecut was only constrained by the fit to be larger than 1.4 PeV and was set to equal the Hillas limit of 4.2 PeV. The solid green line shows the result from the fit that includes the radio upper limits with the B-field as a free parameter but a fixed value for α = 2.2. The dotted lines in the corresponding colours show the emission without absorption.
Current usage metrics show cumulative count of Article Views (full-text article views including HTML views, PDF and ePub downloads, according to the available data) and Abstracts Views on Vision4Press platform.
Data correspond to usage on the plateform after 2015. The current usage metrics is available 48-96 hours after online publication and is updated daily on week days.
Initial download of the metrics may take a while.


