Fig. B.1.
Download original image
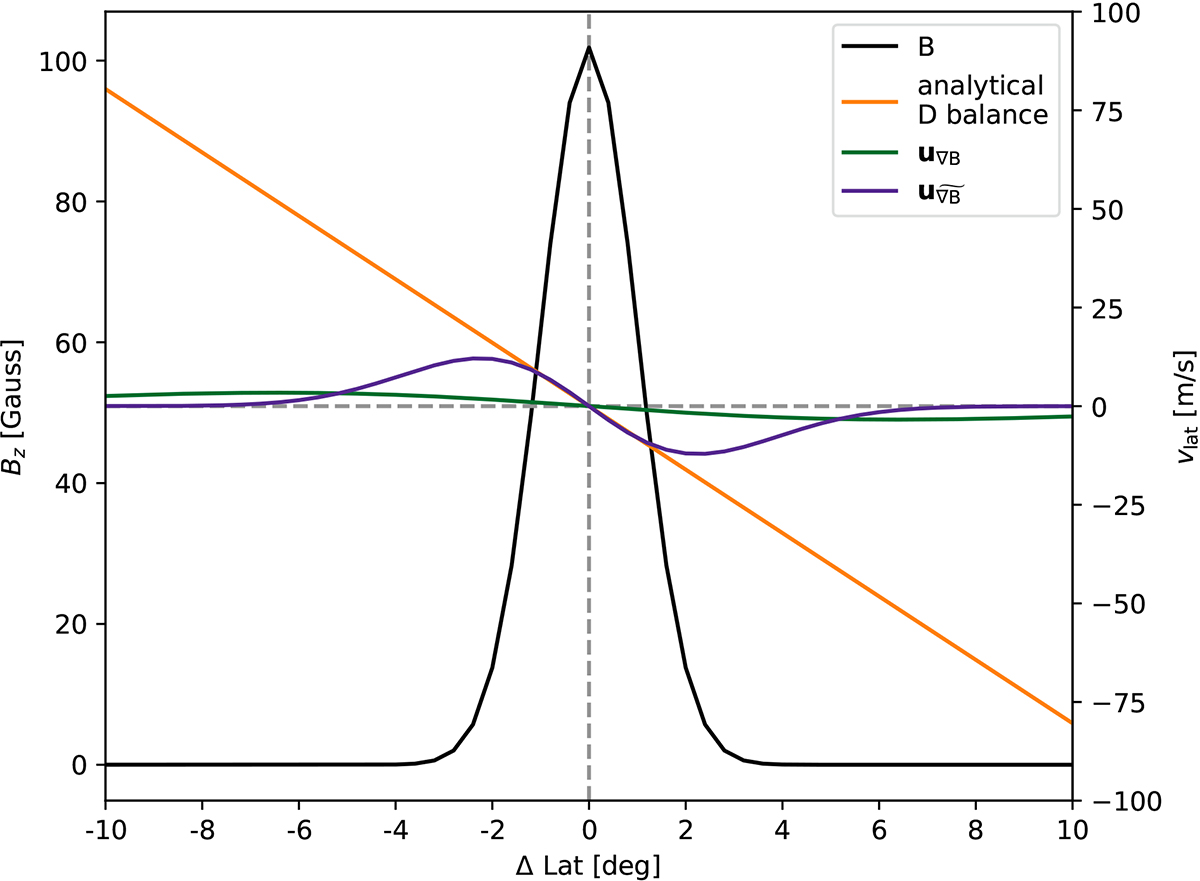
Latitudinal cut through artificial data. The black line indicates the magnetic field, modeled as a Gaussian with a FWHM of 2.4°. The green line indicates the inflow model of u∇B for the shown magnetic field. The purple line indicates the inflow model of ![]() at 2 days after t90% + 0.5 days. The orange line shows the inflow profile that compensates for the diffusion of the magnetic field for a constant diffusivity of 250 km2s−1.
at 2 days after t90% + 0.5 days. The orange line shows the inflow profile that compensates for the diffusion of the magnetic field for a constant diffusivity of 250 km2s−1.
Current usage metrics show cumulative count of Article Views (full-text article views including HTML views, PDF and ePub downloads, according to the available data) and Abstracts Views on Vision4Press platform.
Data correspond to usage on the plateform after 2015. The current usage metrics is available 48-96 hours after online publication and is updated daily on week days.
Initial download of the metrics may take a while.